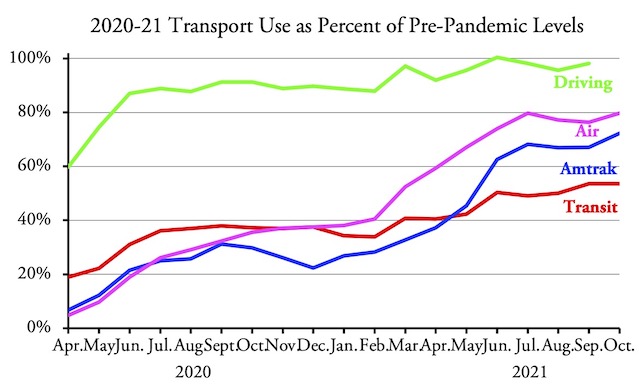
Transit ridership in October 2021 was 53.5 percent of October 2019, a slight drop from September’s 53.6 percent, according to data released yesterday by the Federal Transit Administration. Air travel increased from 76.3 percent to 79.7 percent and Amtrak increased from 67.1 percent to 72.2 percent, so transit continues to lag behind other modes.
Amtrak numbers are from Amtrak’s Monthly Performance Report; air travel numbers are from the Transportation Security Administration. Driving numbers should be available in about a week.
Transit agencies offered 80 percent as much service (measured in vehicle-revenue hours) in October 2021 as they did in the same month of 2019. Though this is down from 86 percent in September, this was mainly because October 2019 saw a large increase in service: October 2021 saw 99.6 percent as many vehicle hours as September 2021.
The biggest discrepancy between ridership and hours of service was for commuter rail, whose October ridership was 57 percent below pre-pandemic levels even though service was only 13 percent less. Commuter-rail riders are most likely to have the kind of jobs that allow them to work at home.
The most wasteful commuter-rail operation was Caltrain, which runs trains between San Francisco and San Jose. In October, it ran more than 97 percent as much service as October 2019, yet attracted less than 18 percent as many riders. Commuter-rail operations in north San Diego County, northern Virginia, and Maryland were almost as bad.
Transit agencies claim that they need to maintain service to allow people to socially distance themselves. That becomes a joke when the transit vehicles are practically empty. The agencies running these trains received so much money from Congress that they have seen little need to respond to declining ridership by cutting service.
As usual, I’ve posted an enhanced spreadsheet with annual ridership and vehicle-revenue mile totals for 2002 through 2021 (to date) by transit agency and urban area. The raw transit data are in cells A1 through IM2242. I’ve added annual totals in columns IN through JG, mode totals in rows 2244 through 2265, agency totals in rows 2270 through 3269 and totals for the 203 largest urban areas in rows 3275 through 3678. Columns JH and JI show October 2021 numbers as a percent of October 2019 and October 2020. All of these enhancements are on both the UPT (unlinked passenger trips) and VRM (vehicle-revenue miles) worksheets.


