
While Americans drove their cars only 84 percent as many miles in 2020 as in 2019, according to data recently published by the Federal Highway Administration, they drove semi-trucks 101 percent as many miles. These and other data are from the 2020 Highway Statistics, an annual compilation of data on the condition, use, and financial status of the nation’s highway network.
 Click image to download a four-page PDF of this policy brief.
Unlike the annual National Transit Database, which the Federal Transit Administration releases as a group of two dozen or so tables together each fall, the Federal Highway Administration releases Highway Statistics incrementally. To date, it has released most of the 2020 tables relating to the extent and performance of highways, but very few financial tables. This policy brief will review some of the non-financial tables that have been released.
Much of the data are divided into functional systems, which include interstate freeways, other freeways, other principal arterials, minor arterials, major collectors, minor collectors, and local roads and streets. These are further broken down into urban and rural. Over time, the number of urban roads has grown, but not entirely because of new construction: some of the growth is due to expansion of urban areas. For example, in many years the number of rural interstate freeways declines because some of the highways have been reclassified as urban roads.
Urban Transit and Driving
One of the tables in Highway Statistics shows the amount of driving people did in each of each of the nation’s 493 urban areas of more than 50,000 people. This can be compared with transit data for those same urban areas to reveal the pandemic’s influence on travel. A table below shows the results for the nation’s largest urban areas; a downloadable file shows the results for all urban areas.
To make the table, a few adjustments were necessary. Most important, the National Transit Database presents passenger-miles for the fiscal years of each transit agency, but I wanted calendar year data to compare with Highway Statistics. The transit data also includes passenger trips by month that can be totaled by calendar year. I converted calendar year trips to passenger miles by multiplying the number of trips carried by each agency and mode by the average length of each trip (passenger miles divided by trips) in the 2019 and 2020 databases.
Using this method, the number of passenger miles carried by transit in calendar year 2019 was 54.14 billion. This compares with 54.10 billion carried in transit agency fiscal years 2019. Similarly, the number of passenger miles carried in calendar year 2020 was 23.46 billion compared with 31.55 billion in fiscal years 2020. The larger difference in 2020 is because most transit agency fiscal years included only three to six months of the pandemic.
I also needed to convert miles of driving in Highway Statistics to passenger-miles. One Highway Statistics table reports passenger-miles using average occupancy data from the 2017 National Household Travel Survey for cars and light trucks. Highway Statistics also assumes that heavy trucks carry 1 passenger-mile per mile. However, I don’t consider truck drivers to be passengers, so I reduce this to 0 passenger-miles per mile. Based on Highway Statistics, the average vehicle carried 1.70 passenger-miles per mile of driving in 2020 and 1.72 in 2019. Reducing trucks to zero passenger-miles reduces average occupancies to 1.60 passenger-miles per mile in 2020 and 1.62 in 2019, which are the numbers I used for the table.
Finally, some transit agencies serve multiple urban areas. Denver’s Regional Transit District also serves Boulder and Longmont; San Francisco BART serves Concord, Vallejo, and Livermore; Utah Transit services Ogden, Provo, and Salt Lake urban areas. There are a few others but those are the most important ones and I adjusted the numbers for these urban areas.
The results show that transit’s share of urban motorized travel fell from 1.6 percent in 2019 to 0.8 percent in 2020. We know rail ridership fell more than bus ridership, so it is not surprising that transit shares fell the most in areas with major rail systems: 59 percent in New York, 64 percent in Chicago, 67 percent in Washington, and 69 percent in San Francisco. Declines were smallest in urban areas with no or almost no rail transit such as Tampa-St. Petersburg (30%) and San Antonio (34%).
- Transit carried 12.0 percent of motorized travel in the New York urban in 2019, but it declined to 6.4 percent in 2020.
- Transit carried 5.7 percent of motorized travel in the San Francisco Bay Area in 2019, declining to 2.1 percent in 2020.
- Chicago, Washington, Seattle, Honolulu, and State College, Pennsylvania were the only other urban areas where transit carried more than 3 percent in 2019, but in 2020 they declined to 2.2 percent in Honolulu and under 2.0 percent in the other urban areas.
- Before the pandemic, transit carried more than 2 percent of motorized travel in only 8 other urban areas: Philadelphia, Boston, Baltimore, Stockton, Anchorage, Ithaca, San Luis Obispo, and Kahului. These all declined to 0.9 to 1.4 percent.
- The only other urban areas where transit still carried 1 percent or more of urban travel in 2020 were Los Angeles (1.1%), Portland (1.2%), and Ames (1.1%).
When does transit’s share become so low that it is functionally irrelevant as transportation? My own opinion, based on transit’s share of commuting, numbers of downtown jobs, and transit’s share of downtown commuting, is that before the pandemic transit was only truly relevant in seven urban areas: New York, Chicago, Philadelphia, Washington, Boston, San Francisco-Oakland, and Seattle. Transit carried more than 2.5 percent of motorized travel in all these areas before the pandemic. In 2020, transit carried more than 2.5 percent of motorized travel only in the New York urban area, so I would argue that transit has become irrelevant everywhere outside of that urban area.
Transit agencies claim that transit was carrying “essential” but low-income workers to work during the pandemic. Before the pandemic, 31.5 percent of low-income workers (those earning less than $25,000 a year) in the New York urban area and 18.1 percent in the San Francisco urban area took transit to work. However, transit’s share of low-income workers was just 10 to 14 percent in Chicago, Boston, Philadelphia, Seattle, and Washington, and under 10 percent almost everywhere else.
Nationally, fewer than 2.4 million low-income workers relied on transit to get to work in 2019, and the number was undoubtedly lower in 2020. The $69 billion in COVID relief funds that Congress gave transit agencies during the pandemic would have been enough to give every one of these workers a $29,000 automobile. While I don’t advocate doing this, it suggests that there were more cost-effective ways of helping essential workers get to work than subsidizing transit.
| 2019 | 2020 | |
|---|---|---|
| New York | 12.0% | 6.4% |
| Los Angeles | 1.8% | 1.1% |
| Chicago | 3.2% | 1.4% |
| Miami | 0.9% | 0.6% |
| Philadelphia | 2.5% | 1.2% |
| Dallas-Ft. Worth | 0.5% | 0.4% |
| Houston | 0.7% | 0.4% |
| Washington | 3.4% | 1.4% |
| Atlanta | 0.8% | 0.4% |
| Boston | 2.5% | 1.2% |
| Detroit | 0.4% | 0.2% |
| Phoenix | 0.6% | 0.4% |
| San Francisco Bay Area | 7.0% | 2.8% |
| Seattle | 3.4% | 1.8% |
| San Diego | 1.3% | 0.9% |
| Minneapolis-St. Paul | 1.0% | 0.5% |
| Tampa-St. Petersburg | 0.4% | 0.3% |
| Denver | 1.7% | 0.9% |
| Baltimore | 2.0% | 1.0% |
| St. Louis | 0.6% | 0.4% |
| San Juan | 0.9% | 0.4% |
| Riverside | 0.5% | 0.3% |
| Las Vegas | 0.9% | 0.6% |
| Portland | 2.0% | 1.2% |
| Cleveland | 0.6% | 0.3% |
| San Antonio | 0.7% | 0.5% |
| Pittsburgh | 1.3% | 0.8% |
| Sacramento | 0.6% | 0.3% |
| San Jose | 0.9% | 0.5% |
| Cincinnati | 0.4% | 0.2% |
| Kansas City | 0.2% | 0.2% |
| Orlando | 0.6% | 0.3% |
| Indianapolis | 0.2% | 0.1% |
| Virginia Beach | 0.3% | 0.2% |
| Milwaukee | 0.5% | 0.4% |
| Columbus | 0.4% | 0.2% |
| Austin | 0.7% | 0.5% |
| Charlotte | 0.4% | 0.2% |
| Providence | 0.5% | 0.4% |
| Jacksonville | 0.3% | 0.2% |
| Memphis | 0.2% | 0.1% |
| Salt Lake-Ogden-Provo | 2.2% | 1.3% |
| Louisville | 0.4% | 0.2% |
| Nashville | 0.2% | 0.1% |
| Richmond | 0.4% | 0.3% |
| Buffalo | 0.6% | 0.5% |
| Hartford | 1.0% | 0.6% |
| Bridgeport | 0.3% | 0.2% |
| New Orleans | 0.7% | 0.3% |
| Raleigh | 0.1% | 0.1% |
| Oklahoma City | 0.1% | 0.1% |
| Tucson | 0.6% | 0.4% |
| El Paso | 0.6% | 0.3% |
| Honolulu | 3.4% | 2.2% |
| Birmingham | 0.1% | 0.1% |
| Albuquerque | 0.7% | 0.3% |
| McAllen | 0.1% | 0.0% |
| Omaha | 0.1% | 0.1% |
| Dayton | 0.5% | 0.4% |
| Rochester | 0.5% | 0.4% |
| Allentown | 0.3% | 0.2% |
| Tulsa | 0.1% | 0.1% |
| Fresno | 0.4% | 0.3% |
| Sarasota | 0.2% | 0.2% |
| Springfield | 0.4% | 0.2% |
| Concord | 0.2% | 0.1% |
| Albany | 0.6% | 0.6% |
| Baton Rouge | 0.1% | 0.1% |
| Mission Viejo | 0.0% | 0.0% |
| Grand Rapids | 0.4% | 0.2% |
| Akron | 0.3% | 0.2% |
| New Haven | 0.3% | 0.3% |
| Colorado Springs | 0.2% | 0.1% |
| Knoxville | 0.1% | 0.1% |
| Columbia | 0.1% | 0.1% |
| Charleston | 0.2% | 0.1% |
| Ogden | 0.0% | 0.0% |
| Cape Coral | 0.2% | 0.1% |
| Bakersfield | 0.4% | 0.2% |
Roadway Extent
The United States had 67,128 miles of freeways in 2020, which was 0.02 percent more than in 2019. The nation’s total road miles of 4.2 million grew by 0.03 percent. Just for comparison, China had about 100,000 miles of freeways in 2020 and is growing its freeway system by almost 5 percent per year. China has more than four times as many miles of freeways as it has high-speed rail, and the freeways are paying for themselves out of tolls while construction of high-speed rail has generated a debt close to $2 trillion that will never be recovered out of rail fares.
China has more people but about the same land area and number of motor vehicles as the United States. As I’ve noted before, the United States shouldn’t build more freeways just because China is building more freeways. But it should build more freeways for the same reason China is building freeways: they are a safe, efficient way of moving both passengers and freight.
According to the Texas Transportation Institute, traffic congestion in 2020 was less than in 2019, but it was still worse than it had been in 1982. From 1982 to 2020, total hours of delay had increased by more than 150 percent and the amount of fuel wasted in traffic more than doubled. During that time, total road miles in the United States increased by 8 percent and lane-miles grew by 10 percent. This was apparently not enough as vehicle-miles of travel grew by 83 percent.
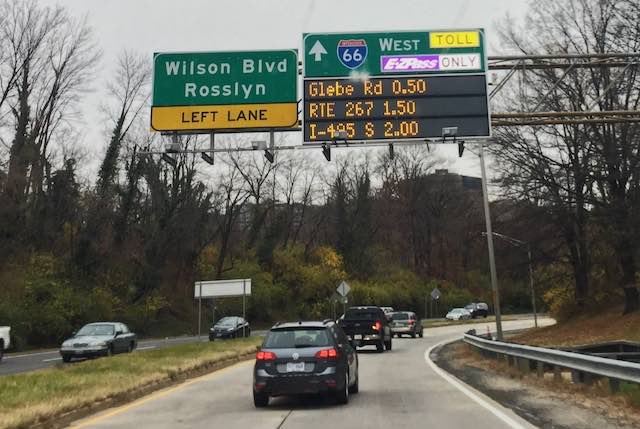
Tolls on Virginia’s I-66 express lanes in the Washington DC area can be more than $40, but they have significantly reduced congestion. Photo by Mike Grinnell.
Congestion exists partly because roads are poorly priced and partly because, when traffic slows down, roads can move fewer vehicles per hour than when they are operating at free-flowing speeds. The best way to avoid congestion is through better road pricing, using either variable tolls or per-mile fees that vary with traffic. This could nearly eliminate congestion, but on roads in high demand the tolls or fees could become very high. For example, current tolls on an 11-mile section of managed lanes of Interstate 66 in Virginia range from $0 to almost $50.
Toll revenues that are greater than are needed to pay for a road and its maintenance are a market signal that new roads or lanes are needed. All such surplus revenues should be dedicated to expanding road capacity, but no general taxes should be spent for roads.
Roadway Conditions
Despite claims of crumbling infrastructure, America’s highway and bridge conditions have improved almost every year since 1990, and 2020 is no exception. The Federal Highway Administration’s bridge report rated 45,031 bridges in poor condition in 2020, a 2.5 percent decline from the 46,163 bridges in poor condition in 2019 and a 67.3 percent decline from the 137,865 in poor condition in 1990. The latest report indicates the number in poor condition declined again to 43,586 bridges in 2021, a 3.2 percent decline from 2020.
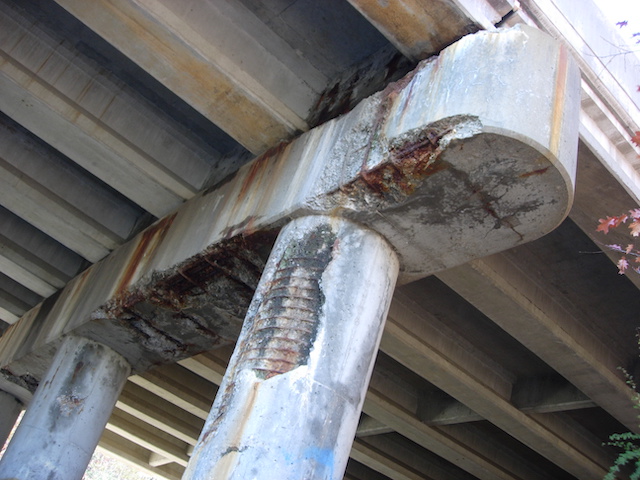
The number of bridges in poor condition declined from nearly 138,000 in 1990 to under 44,000 in 2021. Photo by Richard Klein.
At the rate bridges were being replaced or repaired, no bridges would have been left in poor condition by 2035. The funds in the recent infrastructure bill could speed that up by nearly a decade, but it isn’t clear that such a speed-up was truly necessary. It also isn’t clear that the infrastructure bill will go to the bridges that need it most, which are the ones owned by city and county governments. Most of the money in the bill will go to state highway agencies, which own about 14,000 bridges in poor condition, while cities and counties own more than 26,300 bridges in poor condition.
The most important measure of road conditions is pavement roughness, a measure of the number of inches of bumps per mile. Highway Statistics reports the number of miles of roads of various types with roughness indices under 60, 60 to 94, 95 to 119, and so forth up to more than 220. To calculate an average roughness index for each road type, I used the median of each category along with 50 for the under 60 category and 230 for the over 220 category. The Federal Highway Administration failed to report roughness indices for 2010, so I compared 2020 numbers with 2019 and 2009.
As the table below shows, pavement roughness numbers have declined (meaning roads are smoother) for every major type of roads, both between 2019 and 2020 and between 2009 and 2020. Note that numbers tend to be lowest for interstate highways (which are all state owned and highest for minor arterials (which are mostly city or county owned).
If you think the roads you drive on are getting more potholes, they are probably locally owned, meaning their maintenance is funded mainly out of general taxes. Maintenance of state roads is mostly funded out of user fees, which tends to produce better results. The Federal Highway Administration doesn’t report roughness indices for collectors and local roads, which are nearly all locally owned.
Roadway Performance
Freeways are an amazingly productive form of transportation. Although their cost per lane-mile is about 25 percent to 35 percent more (see page A-4) than a non-freeway arterial or collector, each freeway lane-mile carries about three times as many vehicle miles as a non-freeway arterial lane-mile, and around six times as many as collector roads. As I’ve noted before, freeways are also some of the safest roads while non-freeway arterials are the most dangerous, so there are multiple good reasons to replace non-freeway arterials with freeways.
Driving on all roads declined in 2020, but according to Highway Statistics the biggest declines were on freeways. Total driving declined an average of 11 percent while driving on interstate freeways fell by 13 percent, more than any other roads. The smallest reported decline in driving was on local roads and streets, which fell by only 8 percent.
The local numbers are a little questionable. Highway Statistics relies on traffic counters that are found mainly on freeways and other major arterials. Few traffic counters are used on local streets; instead, Highway Statistics relies on state estimates for those streets, which are not all of equal credibility. Since it is hard to get anywhere while driving only on local roads, I find it difficult to believe that the smallest decline in driving was on such roads. If the local numbers are overestimated, then the total decline in driving due to the pandemic was a little more than reported by the Federal Highway Administration.
Even in 2020, freeways were extraordinarily productive, especially those found in urban areas. The average lane-mile of urban interstate freeway carried 12,443 vehicle-miles per day in 2020, down from 14,742 in 2019. The average rural interstate lane-mile carried 5,286 vehicle-miles per day in 2020, down from 5,967 in 2019. For comparison, the average urban arterial lane-mile hosted under 5,000 vehicle-miles per day in 2020 while the average collector lane-mile was under 2,000; non-freeway rural arterials were around 2,000 vehicle-miles per day while rural collectors were around 500.
The Los Angeles urban area has the most productive freeways, carrying 21,330 daily vehicle-miles per lane-mile in 2020, down from 23,234 in 2019. Neighboring Riverside-San Bernardino was almost as high at 20,529 in 2020 and 22,067 in 2019. No other major urban area freeway system carried more than 20,000 daily vehicle-miles per lane-mile in 2020, but San Francisco-Oakland, San Diego, San Jose, Concord (a suburb of San Francisco), Murrieta (a suburb of Los Angeles), and Modesto did in 2019.
Of course, these are all very congested areas. One of the reasons Los Angeles’ freeway system is so productive is because the region doesn’t have enough freeways. Based on 2019 population estimates (as 2020 numbers are not yet available), the Los Angeles urban area had just 51 miles of freeway per million people in 2020, compared with a national urban-area average of more than 100. Residents respond not by driving less but by driving in congested conditions for more hours of each day.
Motor Vehicles and Fuel Economy
Americans not only drove less in 2020, they owned fewer motor vehicles. In 2020, Americans owned 103.8 million private cars, a 3.1 percent drop from 2019. The number of motorcycles also declined, but the number of private and commercial trucks grew by 2.0 percent. Private bus numbers fell by 1.1 percent but public bus numbers grew by 4.2 percent. In all, there were 271.8 million private vehicles in 2020, a 0.2 percent drop, but 4.1 million public vehicles, a 0.3 percent increase. All of the increase in public vehicles was in transit buses.
A table reporting how many gallons of fuel are used by motor vehicles each year can be compared with total miles driven to calculate average miles per gallon. In 1950, the average motor vehicle—including everything from motorcycles to semi-trucks—got about 13 miles per gallon. This remained essentially unchanged until the “energy crisis” of 1973, after which fuel economies began improving.
Average miles per gallon increased in 37 out of 47 years since then, reaching 24.1 in 2019. In 2020, it grew by 0.8 miles to 24.9 miles per gallon, the second-largest increase since 1949, when data are first available. This large increase is likely related to the decline in motor vehicle numbers as the vehicles junked were probably those with worse-than-average fuel economies.
More detailed information by vehicle type can be found in the Transportation Energy Data Book, which the Department of Energy updates each year. The next update, which will probably be released in early 2022, will have data through 2019.
Resilient Transportation
Highways are efficient, requiring the least subsidies of any public transportation services. I’ll present more information on those subsidies when the financial tables are added to the 2020 Highway Statistics.
Highways are also the most resilient form of transportation because they are simply dumb infrastructure, available for almost anyone to use at minimal maintenance cost. While Congress gave $69 billion in COVID relief funds to transit agencies (which wanted even more), highways received nothing yet still outperformed all other modes of transportation, both in terms of total passenger-miles and ton-miles moved and as a fraction of pre-pandemic numbers.


This 10th Avenue bridge in Minneapolis is a good example that it’s okay for a lot of these bridges “poor condition”. A lot of them are no longer needed. Heck, in this case the bridge may be able to live on forever at minimal cost if the city permanently restricts it to bicycles and peds.
https://www.startribune.com/south-minneapolis-bridge-closed-for-safety-reasons/600130663/
https://www.dot.state.mn.us/historicbridges/L8915.html
Midtown Greenway Bridge (Bridge L8915)
Bridge L8915
Bridge L8915
History & significance
In 1916 the Chicago, Milwaukee and Saint Paul Railroad constructed a series of bridges to separate railroad traffic from city streets. The bridges are identical in plan, dimension, and ornamental detail. Each structure is a three-span, cast-in-place, reinforced-concrete T-beam that rests on round-arch piers. The railings, parapet walls, and wingwalls feature modest Classic Revival details, including ornamental recessed panels and pilasters. Beginning in 2000 the rail lines were removed and the grade separated corridor was converted to a recreational trail, known as the Midtown Greenway, and maintained by the City of Minneapolis.
Big cities have big transportation needs…. even so ,Some cities are bigger than others…. New York is a rectangle so rail transit does an excellent job moving people. CHICAGO is an octopus with tendrils of urban expansion in various arms north south etc. Honolulu is a sea urchin creeping from the coast. Cities like that reach emphases where automotive transit can move significant portions. Vanpools and taxis dedicated to picking up groups instead of individuals….Van transit or mini buses can move 500,000 people a day…..
Is this a serious proposal?
If so, it’s probably important to note that 1) the current bridge already has generous bike and ped spaces as part of its design, including protected bike lanes, 2) there is an exclusive bike/ped facility less than 1/4 mile away connecting the West Bank area to Dinkytown, 3) The bridge is critical for handling commuter traffic to the West Bank campus area and closing it to auto traffic would force all of that traffic through the Seven Corners area, which simply cannot handle it, and 4) we may have short memories, but that bridge is a critical relief route for the I-35W crossing, something that came into particularly sharp focus when the 35W bridge collapsed in 2007.