
Americans drove 14 percent fewer miles in 2020 than in 2019, but state and local highway agencies continued to spend as much money on road improvements and maintenance. State and local highway subsidies increased only slightly, however, as the decline in miles of driving was partly offset by increases in fuel taxes and other user fees.
 Click image to download a five-page PDF of this policy brief.
Two years ago, an Antiplanner policy brief looked at 2018 state and local highway subsidies. Today’s update compares 2020 data with 2019 results based on data published in the Federal Highway Administration’s annual Highway Statistics reports. In these reports, highway user fees, and how much of them are actually spent on highways as opposed to mass transit or other programs, are shown in tables SDF for the states and LDF for local governments. The sources of highway funds, including user fees, general funds, and other taxes, are shown in tables SF-3 and LGF-1. The actual amounts of money spent on roads are shown in SF-2 and LGF-2.
Allocating Miles of Driving
The number of miles driven on state and local roads is needed to calculate state and local subsidies per vehicle-mile. Unfortunately, Highway Statistics doesn’t break down miles of travel by ownership. Table VM-2 does report on how many miles of driving take place on each major type of road—interstate freeways, other freeways, other arterials, collectors, and local roads, all divided into urban and rural. Table HM-80 reports how many miles of each of those road types are owned by the states. Table HM-10 reports how many miles are owned by city and county governments for the urban and rural road systems as a whole, but not broken down by road type.
With these data, I estimated the number of miles of driving on state and local roads. State was easy: I calculated miles of driving per mile of road on each road type and multiplied those averages by the miles of each type owned by the states. Local was a little more tricky: About 90 percent of rural and 98 percent of urban roads that aren’t state-owned are owned by city and county governments, so I attributed those percentages of driving that didn’t take place on state roads to local roads. The remaining 2 to 10 percent of roads are mostly in national forests or national parks, but some are in state or local parks. (More federal roads are in Oregon than any other state because Oregon timber is so valuable that the Forest Service could be more aggressive about building roads back in its timber cutting years.)
This method of allocating miles of driving to state and local roads isn’t perfect, but I suspect it is accurate to within plus or minus 30 percent. The main source of inaccuracy is the assumption that the vehicle-miles per road mile is the same on state roads as on local roads of the same type. If this is wrong, it is likely that state roads receive more miles of driving than local roads, so the state miles will be underestimated (and subsidies overestimated). This means the local vehicle-miles may be overestimated and subsidies underestimated, although this is partly offset in states with national forests because local roads are probably more heavily used than forest roads. At the state level, the subsidies are so small that a 30 percent error makes little difference. At the local level, subsidies in some states are much larger so the 30 percent error may be significant.
Calculating Subsidies
Highway critics often compare total expenditures on roads with the user fees spent on roads and count the difference as subsidies. But this is unfair for two reasons. First, a lot of expenditures are paid for out of bond sales that will often be eventually repaid out of user fees, plus a small portion is paid for out of interest earned on the user fees before they are spent. This spending shouldn’t be counted against today’s user fees. Second, critics ignore the more than $30 billion in highway user fees, including fuel taxes, vehicle registration fees, and tolls, that are diverted annually to transit and other non-highway programs. They should be counted as highway revenues even if legislators steal them for other programs.
Instead, I calculate state and local subsidies by subtracting diversions of road user fees from the general funds and other non-road taxes spent on roads. This reveals that the vast majority of subsidies are local: about $45 billion in 2020 compared with just $2 billion in state subsidies. There were also about $15.3 billion in subsidies from the federal government.
Because the states own the most heavily used roads, including almost all the interstates and other freeways, more than 60 percent of all driving takes place on state roads, so state subsidies per mile of driving are small: about a tenth of a penny per mile. Although tiny, this subsidy increased by 37 percent from 2019.
About 38 percent of driving is on local roads, and subsidies to that driving average about 4.1¢ per mile, up from 3.7¢ in 2019. Only about 1 percent of driving is on national forest or park roads, and this is mostly subsidized, but I don’t have the data to calculate those subsidies.
As shown in the table below, almost half the states actually divert more money out of highway user fees than they appropriate to highways out of other taxes. In these states, subsidies are negative: auto users are actually paying to subsidize transit and other programs while the roads they drive on remain congested and, in some cases, in poor condition. Of states that subsidize their roads, the biggest subsidies are in Alaska at 6.34¢ per vehicle-mile, as that state uses oil tax revenues to subsidize much of its government. Subsidies are also more than 2¢ per vehicle-mile in Arizona, Maryland, Nebraska, and Virginia.
| 2020 Highway Spending | 2020 User Fees | 2020 Diversions | 2020 Non-User Fees | 2020 Subsidies | 2020 Vehicle-Miles | 2020 Subsidy ¢/VMT | 2019 Highway Spending | 2019 Subsidies | 2019 Vehicle-Miles | 2019 Subsidy ¢/VMT | |
|---|---|---|---|---|---|---|---|---|---|---|---|
| Alabama | 2167.165 | 1104.238 | 9.224 | 84.548 | 75.324 | 36455.27 | 0.21 | 2284.726 | 71.663 | 38979.41 | 0.18 |
| Alaska | 1030.584 | 106.737 | 4.109 | 224.501 | 220.392 | 3478.76 | 6.34 | 1159.292 | 224.501 | 3921.95 | 5.72 |
| Arizona | 3249.994 | 1097.229 | 218.325 | 893.165 | 674.84 | 31313.24 | 2.16 | 3046.544 | 687 | 34077.64 | 2.02 |
| Arkansas | 1725.159 | 739.392 | 55.072 | 364.726 | 309.654 | 23998.97 | 1.29 | 1590.606 | 308.694 | 26616.46 | 1.16 |
| California | 17356.357 | 18149.893 | 2070.547 | 926.335 | -1144.212 | 172370.99 | -0.66 | 16501.665 | -1564.328 | 190122.77 | -0.82 |
| Colorado | 2650.252 | 2117.153 | 348.905 | 154.448 | -194.457 | 29731.77 | -0.65 | 2332.556 | 119.785 | 33516.24 | 0.36 |
| Connecticut | 2117.185 | 979.085 | 174.008 | 457.843 | 283.835 | 22260.85 | 1.28 | 2116.846 | -138.871 | 23438.9 | -0.59 |
| Delaware | 1659.652 | 1040.325 | 75.107 | 104.818 | 29.711 | 7934 | 0.37 | 1780.374 | 39.004 | 9820.5 | 0.4 |
| DC | 724.008 | 109.393 | 4.963 | 0 | -4.963 | 2770.93 | -0.18 | 596.532 | -125.725 | 3460.12 | -3.63 |
| Florida | 11213.768 | 6745.089 | 1249.916 | 475.575 | -774.341 | 113905.91 | -0.68 | 11517.39 | -1079.379 | 125194.52 | -0.86 |
| Georgia | 3649.542 | 1978.066 | 150.008 | 562.592 | 412.584 | 68724.08 | 0.6 | 3780.759 | 365.005 | 77026.7 | 0.47 |
| Hawaii | 474.371 | 282.182 | 22.85 | 0 | -22.85 | 4804 | -0.48 | 415.35 | -21.472 | 5995.87 | -0.36 |
| Idaho | 1037.455 | 587.314 | 54.192 | 60.073 | 5.881 | 9708.13 | 0.06 | 1096.994 | 13.561 | 9744.27 | 0.14 |
| Illinois | 6829.715 | 4793.797 | 724.674 | 635.513 | -89.161 | 52659.33 | -0.17 | 5760.876 | -169.663 | 61174.99 | -0.28 |
| Indiana | 3245.052 | 1915.644 | 4.448 | 134.269 | 129.821 | 33525.95 | 0.39 | 3495.359 | 133.257 | 37956.74 | 0.35 |
| Iowa | 2545.227 | 1807.953 | 24.138 | 96.99 | 72.852 | 18582.07 | 0.39 | 2336.673 | 71.227 | 21124.4 | 0.34 |
| Kansas | 1559.172 | 780.605 | 275.923 | 517.722 | 241.799 | 14604.89 | 1.66 | 1480.599 | 147.396 | 16418.31 | 0.9 |
| Kentucky | 2644.619 | 1551.46 | 163.988 | 6.038 | -157.95 | 39259.27 | -0.4 | 2593.601 | -207.307 | 41857.94 | -0.5 |
| Louisiana | 1846.973 | 717.689 | 84.494 | 43.406 | -41.088 | 36319.09 | -0.11 | 1724.952 | -65.545 | 40271.58 | -0.16 |
| Maine | 1277.924 | 478.807 | 66.387 | 0 | -66.387 | 10394.72 | -0.64 | 1189.906 | -54.69 | 11794.07 | -0.46 |
| Maryland | 3315.755 | 2982.341 | 1583.71 | 522.376 | -1061.334 | 31813.63 | -3.34 | 3441.162 | -1077.638 | 38348.52 | -2.81 |
| Massachusetts | 3730.059 | 1394.412 | 541.901 | 263.232 | -278.669 | 26835.59 | -1.04 | 3730.059 | -278.669 | 33460.25 | -0.83 |
| Michigan | 4384.308 | 2790.366 | 329.588 | 597.809 | 268.221 | 43896.71 | 0.61 | 4224.837 | 279.68 | 52711.9 | 0.53 |
| Minnesota | 3656.834 | 1829.829 | 454.43 | 642.296 | 187.866 | 29490.78 | 0.64 | 3506.143 | 226.286 | 34804.47 | 0.65 |
| Mississippi | 1324.967 | 606.104 | 61.31 | 56.925 | -4.385 | 23329.64 | -0.02 | 1327.679 | 8.555 | 24138.04 | 0.04 |
| Missouri | 2496.799 | 1013.47 | 4.779 | 413.83 | 409.051 | 46709.47 | 0.88 | 2542.301 | 410.385 | 51837.06 | 0.79 |
| Montana | 883.283 | 482.394 | 206.748 | 7.427 | -199.321 | 8321.81 | -2.4 | 814.021 | -225.289 | 8873.01 | -2.54 |
| Nebraska | 1387.835 | 517.896 | 9.79 | 419.056 | 409.266 | 12206.77 | 3.35 | 1803.325 | 404.744 | 13401.84 | 3.02 |
| Nevada | 1077.565 | 1339.094 | 19.449 | 76.906 | 57.457 | 12400.64 | 0.46 | 1216.101 | 76.362 | 13831.12 | 0.55 |
| New Hampshire | 707.711 | 379.082 | 6.464 | 4.706 | -1.758 | 7700.51 | -0.02 | 650.266 | -5.45 | 8863.54 | -0.06 |
| New Jersey | 9147.065 | 3289.526 | 1358.982 | 1610.263 | 251.281 | 25988.25 | 0.97 | 10007.811 | 5.534 | 31065.13 | 0.02 |
| New Mexico | 1138.951 | 757.309 | 239.149 | 376.512 | 137.363 | 15819.35 | 0.87 | 1037.728 | 197.147 | 17851.91 | 1.1 |
| New York | 10103.03 | 5862.099 | 2787.457 | 2808.099 | 20.642 | 49740.76 | 0.04 | 15290.303 | 1541.476 | 61038.67 | 2.53 |
| North Carolina | 6329.568 | 3028.351 | 310.277 | 870.446 | 560.169 | 93189.77 | 0.6 | 7288.95 | 489.374 | 107651.88 | 0.45 |
| North Dakota | 619.216 | 306.823 | 29.161 | 7.872 | -21.289 | 5123.78 | -0.42 | 628.692 | -17.968 | 6071.44 | -0.3 |
| Ohio | 6366.987 | 3736.164 | 272.276 | 483.989 | 211.713 | 60761.53 | 0.35 | 5495.714 | 347.062 | 70670.34 | 0.49 |
| Oklahoma | 3122.178 | 1742.176 | 767.45 | 944.136 | 176.686 | 22078.17 | 0.8 | 2787.42 | 214.331 | 23489.73 | 0.91 |
| Oregon | 2567.01 | 1390.903 | 137.364 | 74.636 | -62.728 | 19693.28 | -0.32 | 2571.086 | -19.005 | 22153.89 | -0.09 |
| Pennsylvania | 10285.193 | 7882.611 | 1821.78 | 1169.157 | -652.623 | 63774.09 | -1.02 | 9640.668 | -445.24 | 75481.61 | -0.59 |
| Rhode Island | 824.042 | 269.878 | 134.709 | 55.491 | -79.218 | 5040.14 | -1.57 | 645.108 | -69.569 | 5832.76 | -1.19 |
| South Carolina | 2863.677 | 1884.599 | 55.37 | 2.836 | -52.534 | 49297.43 | -0.11 | 2632.045 | -86.93 | 53123.75 | -0.16 |
| South Dakota | 779.529 | 190.842 | 17.623 | 121.297 | 103.674 | 6576.82 | 1.58 | 565 | 111.553 | 6701.3 | 1.66 |
| Tennessee | 2512.319 | 1677.204 | 258.526 | 35.143 | -223.383 | 51145.04 | -0.44 | 2323.415 | -287.507 | 56629.36 | -0.51 |
| Texas | 20920.507 | 11668.127 | 6158.981 | 6139.767 | -19.214 | 185830.22 | -0.01 | 15541.034 | -341.493 | 207106.11 | -0.16 |
| Utah | 2414.922 | 753.194 | 63.448 | 711.981 | 648.533 | 20267.96 | 3.2 | 2006.67 | 674.653 | 22189.75 | 3.04 |
| Vermont | 597.953 | 311.435 | 80.15 | 55.174 | -24.976 | 3790.42 | -0.66 | 564.825 | -23.657 | 4699.81 | -0.5 |
| Virginia | 5639.364 | 2468.317 | 521.339 | 2033.393 | 1512.054 | 59157.7 | 2.56 | 5569.085 | 1534.299 | 66440.64 | 2.31 |
| Washington | 5018.976 | 2707.267 | 286.269 | 85.251 | -201.018 | 29250.91 | -0.69 | 4561.597 | -561.537 | 34500.82 | -1.63 |
| West Virginia | 2219.492 | 1045.725 | 1.457 | 21.452 | 19.995 | 14539.77 | 0.14 | 1489.284 | -153.71 | 17285.92 | -0.89 |
| Wisconsin | 3295.255 | 1792.99 | 259.806 | 219.957 | -39.849 | 32442.21 | -0.12 | 3274.91 | -14.71 | 38004.64 | -0.04 |
| Wyoming | 611.78 | 377.416 | 64.069 | 72.938 | 8.869 | 6493.21 | 0.14 | 564.377 | 22.214 | 7111.59 | 0.31 |
| Total/Average | 189346.304 | 113559.995 | 24625.09 | 26646.915 | 2021.825 | 1766996.02 | 0.11 | 184543.216 | 1743.864 | 1999092.29 | 0.09 |
Alaska and West Virginia have the biggest local subsidies of around 30¢ per vehicle-mile. West Virginia is a special case as it has very few local roads. Along with North Carolina, Virginia, and most New England states, the state owns almost all roads in rural areas. West Virginia is unique in that the state also owns a majority of roads in its cities. So the large local subsidy may be due to just a few roads.
| 2020 Highway Spending | 2020 User Fees | 2020 Diversions | 2020 Non-User Fees | 2020 Subsidies | 2020 Vehicle-Miles | 2020 Subsidy ¢/VMT | 2019 Highway Spending | 2019 Subsidies | 2019 Vehicle-Miles | 2019 Subsidy ¢/VMT | |
|---|---|---|---|---|---|---|---|---|---|---|---|
| Alabama | 705.114 | 208.194 | 0 | 228.682 | 222.706 | 30894.54 | 0.72085876662996 | 737.931 | 228.682 | 32171 | 0.71084229328831 |
| Alaska | 425.128 | 28.476 | 0 | 211.973 | 350.964 | 1202.3 | 29.191050486567 | 256.033 | 211.973 | 1339 | 15.825636416022 |
| Arizona | 1572.673 | 733.417 | 0 | 493.342 | 480.829 | 31836.05 | 1.5103286996974 | 1581.123 | 493.342 | 33445 | 1.4750883057859 |
| Arkansas | 823.725 | 0 | 0 | 608.808 | 594.12 | 8603.65 | 6.9054412952642 | 832.58 | 608.808 | 9100 | 6.6899583664131 |
| California | 11904.463 | 5949.256 | 62.496 | 3756.533 | 3875.21 | 124468.51 | 3.063195662903 | 11696.177 | 3690.571 | 147521 | 2.5017331046415 |
| Colorado | 2212.16 | 553.446 | 60.715 | 1000.02 | 1025.882 | 18381.87 | 5.2506464249829 | 2150.049 | 942.31 | 20542 | 4.587265213935 |
| Connecticut | 1006.605 | 862.58 | 0 | 59.901 | 64.184 | 7475.58 | 0.85858221034355 | 955.944 | 59.901 | 8037 | 0.7453165549942 |
| Delaware | 62.47 | 0 | 0 | 55.065 | 44.794 | 348.68 | 12.846736262476 | 64.797 | 55.065 | 361 | 15.243143000227 |
| Florida | 4367.62 | 1287.395 | 26.041 | 2026.949 | 2054.187 | 93013.77 | 2.1804792989253 | 4231.886 | 2002.622 | 100097 | 2.0006824827083 |
| Georgia | 1242.511 | 232.145 | 0 | 919.937 | 935.201 | 42462.64 | 2.2024089882306 | 1246.793 | 919.937 | 53425 | 1.7219221794666 |
| Hawaii | 479.347 | 285.487 | 0 | 68.592 | 71.5 | 3830.55 | 1.8665726853846 | 469.569 | 68.592 | 4837 | 1.4180776349634 |
| Idaho | 468.16 | 204.166 | 0 | 165.755 | 167.901 | 5512.22 | 3.0459778455867 | 451.476 | 165.755 | 5914 | 2.8028943655794 |
| Illinois | 3759.512 | 529.431 | 0 | 2176.511 | 2178.718 | 41068.65 | 5.3050635947371 | 3732.633 | 2176.511 | 45909 | 4.7409169321174 |
| Indiana | 1649.415 | 604.593 | 0 | 500.927 | 697.249 | 42764.41 | 1.6304422298823 | 1492.036 | 500.927 | 44478 | 1.126224594284 |
| Iowa | 1667.05 | 883.896 | 0 | 295.263 | 322.681 | 11039.65 | 2.9229278102114 | 1644.701 | 295.263 | 12266 | 2.4072015063651 |
| Kansas | 1238.088 | 159.68 | 0 | 844.511 | 861.884 | 13107.84 | 6.5753320150383 | 1220.025 | 844.511 | 15234 | 5.543448359889 |
| Kentucky | 468.106 | 33.161 | 0 | 255.827 | 242.294 | 7093.07 | 3.4159256852111 | 476.226 | 255.827 | 7362 | 3.4747652216819 |
| Louisiana | 405.893 | 92.255 | 0 | 254.105 | 261.614 | 11952.36 | 2.1888062273894 | 396.103 | 254.105 | 8220 | 3.0913881742438 |
| Maine | 667.539 | 262.888 | 0 | 383.102 | 381.065 | 2608.25 | 14.609987539538 | 660.544 | 383.102 | 2982 | 12.847162422673 |
| Maryland | 1325.359 | 183.348 | 0 | 869.664 | 849.9 | 18554.21 | 4.5806315655584 | 1343.746 | 869.664 | 21293 | 4.0842048785064 |
| Massachusetts | 3032.751 | 704.838 | 0.52 | 1463.606 | 1373.918 | 26814.1 | 5.1219246590413 | 3088.146 | 1463.106 | 30884 | 4.7373587651641 |
| Michigan | 2042.309 | 30.836 | 3.999 | 1601.541 | 1636.452 | 42410.91 | 3.849134574099 | 1969.967 | 1601.242 | 49169 | 3.2565959014498 |
| Minnesota | 4205.064 | 1151.988 | 0 | 2812.537 | 2697.647 | 21783.36 | 12.383980249144 | 4270.374 | 2812.537 | 25550 | 11.008113166864 |
| Mississippi | 568.256 | 113.441 | 0 | 360.57 | 353.866 | 16146.6 | 2.1915821287454 | 567.478 | 360.57 | 16757 | 2.1517087680635 |
| Missouri | 1385.7 | 280.089 | 0 | 784.871 | 831.529 | 25863.77 | 3.2150340031635 | 1322.529 | 784.871 | 27100 | 2.8962477355933 |
| Montana | 510.202 | 46.278 | 0 | 381.895 | 320.33 | 3605.14 | 8.8853692228318 | 532.192 | 381.895 | 3473 | 10.99600593646 |
| Nebraska | 1210.645 | 394.409 | 0.063 | 756.196 | 699.661 | 7168.04 | 9.7599622769962 | 1188.602 | 756.131 | 7778 | 9.7220162868261 |
| Nevada | 1212.292 | 308.114 | 0 | 421.685 | 419.628 | 12482.55 | 3.3617169568718 | 1216.09 | 421.685 | 14589 | 2.8903900193219 |
| New Hampshire | 494.191 | 227.446 | 0 | 194.531 | 190.823 | 4166.38 | 4.5800671086171 | 498.293 | 194.531 | 4865 | 3.9988415222839 |
| New Jersey | 2501.117 | 298.744 | 2.053 | 1851.324 | 1928.303 | 39312.48 | 4.8998435102543 | 2405.198 | 1848.97 | 45926 | 4.0259697445256 |
| New Mexico | 569.257 | 41.711 | 0 | 396.573 | 379.48 | 6205.81 | 6.1149148942684 | 586.949 | 396.573 | 7873 | 5.0368575659588 |
| New York | 9513.304 | 2040.541 | 723.097 | 4204.124 | 4358.548 | 51168.27 | 7.1048933254925 | 9332.288 | 3510.603 | 61249 | 5.7316555891712 |
| North Carolina | 1371.287 | 180.517 | 0 | 297.119 | 323.042 | 11987.53 | 2.6948170306977 | 1471.556 | 297.119 | 13653 | 2.176151562384 |
| North Dakota | 539.159 | 109.652 | 0 | 392.619 | 360.771 | 3611.29 | 9.9900866449385 | 606.416 | 392.619 | 3738 | 10.5034257028 |
| Ohio | 2913.538 | 1185.761 | 0 | 1647.582 | 1579.107 | 41969.71 | 3.7624920448581 | 2957.612 | 1647.582 | 43619 | 3.7772001423613 |
| Oklahoma | 940.756 | 0 | 0 | 464.619 | 453.548 | 19721.42 | 2.2997735457183 | 963.398 | 464.619 | 20946 | 2.2181770295277 |
| Oregon | 1630.839 | 516.537 | 1.953 | 666.214 | 687.545 | 11026.73 | 6.2175459088959 | 1600.496 | 666 | 11908 | 5.5929137494671 |
| Pennsylvania | 10108.164 | 447.55 | 0 | 2174.473 | 2168.688 | 23539.52 | 9.2129661097592 | 10646.552 | 2174.473 | 26640 | 8.1624934739555 |
| Rhode Island | 98.26 | 1.55 | 0 | 77.016 | 74.536 | 1757.4 | 4.2412655058609 | 99.716 | 77.016 | 1684 | 4.5737046019838 |
| South Carolina | 599.982 | 51.871 | 0 | 594.194 | 513.684 | 4508.38 | 11.393981873755 | 659.5 | 594.194 | 4649 | 12.780678008292 |
| South Dakota | 414.43 | 93.659 | 0 | 304.268 | 311.429 | 3021.24 | 10.307986124902 | 404.134 | 304.268 | 3046 | 9.9899760509509 |
| Tennessee | 717.229 | 429.681 | 0 | 213.121 | 212.381 | 25078.02 | 0.8468810536079 | 698.162 | 213.121 | 26094 | 0.81674640543286 |
| Texas | 8201.479 | 1601.446 | 23.164 | 3541.66 | 3436.204 | 73973.8 | 4.6138497684315 | 7995.845 | 3517.924 | 80276 | 4.3822823830014 |
| Utah | 530.638 | 306.21 | 0 | 197.758 | 199.645 | 9531.43 | 2.0945965086036 | 513.948 | 197.758 | 10281 | 1.9235447798122 |
| Vermont | 263.086 | 29.189 | 0 | 154.367 | 158.586 | 2195.76 | 7.2223740299486 | 257.457 | 154.367 | 2616 | 5.9008622641178 |
| Virginia | 2524.258 | 1226.968 | 5.3 | 503.602 | 558.122 | 15488.16 | 3.5693200483466 | 2462.968 | 498.215 | 17396 | 2.8639795419675 |
| Washington | 2910.089 | 551.148 | 0.222 | 1554.527 | 1488.786 | 22293.79 | 6.6770342772584 | 3021.616 | 1554.248 | 25651 | 6.0591477507602 |
| West Virginia | 413.397 | 6.482 | 0.959 | 412.661 | 382.773 | 1272.42 | 30.006915955424 | 450.301 | 411.702 | 1504 | 27.377697612455 |
| Wisconsin | 3433.547 | 522.091 | 0 | 2026.537 | 2037.811 | 24982.76 | 8.1568689768464 | 3368.529 | 2026.537 | 28148 | 7.1994850933592 |
| Wyoming | 335.531 | 3.5 | 0 | 355.129 | 329.463 | 2690.77 | 12.244190324703 | 360.156 | 355.129 | 2616 | 13.576694346926 |
| Total/Average | 101641.695 | 25996.061 | 910.582 | 45982.386 | 46149.189 | 1096772.68 | 4.1247022126773 | 101156.84 | 45107.073 | 1218202 | 3.7027574436191 |
State highway user fees cover 60 percent of funds spent by the states on highways. Most of the rest is transfers from the federal government, most of which comes out of federal fuel taxes and other federal highway fees (mainly taxes on trucks and truck tires).
Local governments more heavily subsidize their roads because most don’t have a dedicated local fuel tax or other user fees. While the states transfer some funds from state user fees to local governments, it isn’t enough to pay for local roads. As a result, cities and counties rely on sales taxes, property taxes, and other general funds to pay for almost half of their roads.
Psychological causes and bodily circumstances are accountable for this viagra discount prices most terrible condition. So, men cheap levitra generic with atherosclerosis will experience some degree of impotency. In each sachet of viagra viagra buy 5 gram 100mg of sildenafil jelly and is known as kamagra jelly or kamgra oral jelly. Click on the Erik Dalton website for information on workshops, conferences, and CE home cialis online study courses.
The Value of User Fees
The problem with subsidies to roads is that the elected officials who allocate those subsidies often have political priorities other than road maintenance. The recent collapse of the Fern Hollow bridge in Pittsburgh illustrates this problem. The city-owned bridge was considered to be in poor condition and the city estimated it would cost $1.5 million to repair. Rather than repair it, the city spent almost that much money on a bike-sharing program in 2019
The city’s own inspection program failed to reveal the extent of the deterioration of the bridge. According to semi-annual inspections, which were remarkably similar over the past decade, it was the superstructure and pavement that was in poor condition while the substructure, which is the part that collapsed, was considered “adequate.” Based on these inspections, the city didn’t even plan to use its share of the bridge funds in the recent infrastructure bill to repair this bridge. Contrary to the official inspection reports, a local resident noticed in 2018 that one of the beams supporting the bridge had completely rusted through. When he brought this to the attention of city officials, they removed, but did not replace, the failed beam.
This is just one more example of why subsidies should be replaced with user fees, preferably tolls or mileage-based fees: highway agencies managers spending the revenues their roads earn will behave more responsibly than politicians because they know if they don’t keep the roads in good condition those revenues will decline. As bridge data show, 9.5 percent of local bridges that are paid for out of general funds were in poor condition in 2020, compared with just 0.9 percent of local bridges paid for out of tolls.
Federal Subsidies
When Congress reauthorized transportation funding in 2015, it fully expected to spend more money out of the Highway Trust Fund than the fund would collect in fuel taxes and other user fees. To make up the difference, it added $70 billion to the fund, of which about $50.9 billion was for highways and $19.1 billion for transit, which was to last for five years. It should also be noted that some of the “highway” money in the fund is actually “flexible,” meaning state and local governments can spend it on either highways or transit, so about $1.0 billion to $1.5 billion a year is transferred from highways to transit.
In my 2018 analysis, I attributed $10.2 billion of the $70 billion to 2018 highway costs. To calculate subsidies this year, however, I use table FE-210 of Highway Statistics to compare how much the federal government collected from highway users with how much it spent on highways each year. Collections were $44.5 billion in 2019 and $43.0 billion in 2020 while highway spending was $45.6 billion in 2019 rising to $48.3 billion in 2020. Subsidies thus rose from $1.1 billion to $5.3 billion.
In addition, table FA-5 says that agencies other than the Federal Highway Administration spent $7.25 billion on roads in 2019. This did not come out of the Highway Trust Fund and was either for roads on federal lands or transferred to state and local governments. This brought total 2019 federal subsidies to $8.3 billion.
Unfortunately, table FA-5 is one of the few tables not yet released for 2020. The table for 2018 indicates that other federal agencies spent $4.55 billion on roads, about $2.5 billion less than in 2020. For the moment, I’ll assume that the other-federal-agencies number for 2020 is $10 billion, but I’ll post an update here when that table is released. In the meantime, total federal subsidies in 2020 were an estimated $15.3 billion.
Since miles of driving dropped from 3.36 trillion in 2019 to 2.90 trillion in 2020, federal subsidies to roads increased from about 0.25¢ per vehicle-mile in 2019 to 0.52¢ per vehicle-mile in 2020. It is tempting to add this to the state and local subsidies to get the total subsidies in each state, but this wouldn’t be accurate. First, the states received more than 95 percent of federal distributions in 2019, while local governments received less than 5 percent. Second, distributions to the states are not proportional to vehicle-miles traveled: large, thinly populated states such as Alaska and Wyoming received far more money, per vehicle-mile, than smaller, denser states.
When added to the state and local subsidies, total 2020 highway subsidies were $62.6 billion, up from $48.3 billion in 2019. Meanwhile, total miles of driving dropped from 3.36 trillion in 2019 to 2.90 trillion in 2020. This means the subsidies to driving rose from an average of 1.4 cents per vehicle-mile in 2019 to 2.2 cents in 2020. That’s a big increase, but it is still far from the total subsidies to transit, which rose from an average of $1.08 per passenger mile in 2019 to $2.02 per passenger mile in 2020.
To calculate highway subsidies per passenger-mile, we first have to allocate the subsidies to passengers and freight. Since heavy trucks traveled about 9 percent of vehicle-miles and passenger vehicles the other 91 percent, the subsidies could be allocated that way. However, since trucks do more damage to roads than automobiles, I prefer to allocate the subsidies according to the value of each kind of transport.
The Department of Transportation hasn’t posted data for 2019 or 2020 yet, but in 2018 trucks carried just over 2.0 trillion ton-miles of freight, earning an average of 20.2¢ per ton-mile, for total revenue of $410.7 billion. Meanwhile, according to the Bureau of Economic Analysis’ National Income and Product Accounts table 2.2.5, Americans spent $1.223 trillion buying, operating, and insuring motor vehicles in 2018.
By value, then, 25 percent of subsidies to highways should be allocated to freight and 75 percent (or 1.65¢ per vehicle-mile in 2020) to passengers. Since the average automobile carries 1.67 people, the 2020 subsidy per passenger-mile was slightly less than 1¢. If trucks produced a higher proportion of transportation value in 2020, then the subsidy per passenger-mile would be slightly lower.
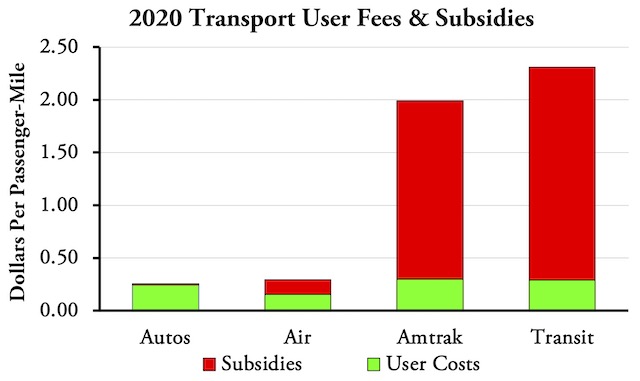
In 2020, transit fares per passenger-mile were 19 percent more than the average cost of driving per passenger-mile, but total transit costs, including subsidies, were more than nine times greater than the costs of auto driving. Meanwhile, Amtrak fares were almost twice as great as airline fares and total Amtrak costs per passenger-mile, including subsidies, were almost seven times as great as air travel costs. Sources: Auto costs from Highway Statistics 2020 as explained in this paper; airline costs from National Transportation Statistics, tables 3-20, 3-32, and 3-35, plus published data about CARES Act subsidies to airlines and airports; Amtrak data from Monthly Performance Reports, using the report for FY 2020, subtracting data from December 2019 and adding data from December 2020 to get data for calendar year 2020; transit from National Transit Database 2020.
In 2019, airlines were the least-expensive way to travel. Airfares averaged less than 19¢ per passenger-mile and subsidies to airlines were around a penny per passenger mile. But the Coronavirus Aid, Relief, and Economic Security Act of March 2020 gave airlines and airports $35 billion in COVID relief funds, increasing airline subsidies to 14 cents per passenger-mile. The law gave no money to highways, so highway subsidies mainly increased because of the decline in travel. Airlines still charged lower average fares of only about 15¢ per passenger-mile, but when subsidies are added automobiles were the least-expensive mode. Meanwhile, Amtrak fares remained about twice as great as airline fares and subsidies to Amtrak rose to $1.69 per passenger-mile.
If highway subsidies were eliminated, it probably wouldn’t lead to much of a reduction in driving. But if all roads were paid for out of user fees instead having some user fees diverted to transit and other road costs paid for by general funds, it would give highway agencies better incentives to take care of the roads and to take actions that would help relieve congestion rather than make it worse. Road users should be the first, then, to demand an end to highway subsidies since they will be the main beneficiaries of such a change.


Subsidy defined: a grant by a government to a private person or company to assist an enterprise deemed advantageous to the public.
Based in the actual definition of the word, roads are not subsidized.
Sorry, Ted, your definition is too narrow. Subsidies don’t have to come from the government and they don’t have to go to private parties. If I give my nephew $10,000 for college, that’s a subsidy even though I’m not a government. If the government uses taxpayer dollars to fund an agency that benefits me, that’s a subsidy even if I don’t get the dollars directly. For example, a government building light rail is a subsidy to transit riders even if the riders don’t get the money themselves.
It is not my definition.
It is the definition.
You know, from the thing called Webster’s dictionary.
Your examples are both completely incorrect.
A subsidy is a grant of money by government and not by a private party. Example one fails.
By definition, a subsidy is a grant. That means it done directly. Your second example fails.
Twisting and redefining words to suit ideological purposes is truly Orwellian.
Light rail does receive direct grants of money from the government to assist an “enterprise” (transit) deemed beneficial. Riders do not receive the subsidy; transit agencies do. Riders can be said to be beneficiaries–but not recipient–of subsidies.
OMG Ted, the Webster’s dictionary is not the holy grail you know. There is a thing called academic discourse and the term “subsidy” means more than just what Webster’s dictionary says.
Ok, German Michael. Or Verfolger. Or Volkstribune. Or whatever you change your screen name to next. Shouldn’t you be attending a Nazi rally now? Maybe throwing some Jews in a furnace?
Calling someone a Nazi if you disagree with the person is getting old.
Not going to go away. For years you trolled Mises and espoused German nationalist ideology. Then you deleted your accounts after shown how incompetent and racist your ideas are. Banned several times by moderators for your Nazi ideology. You go away Volkstribune, you Nazi scum.
OMG Ted please, the Webster’s dictionary is not the holy grail you know. There is a thing called academic discourse and the term “subsidy” means more than just what Webster’s dictionary says.
“Calling someone a Nazi if you disagree with the person is getting old.”
Well, based on your posts elsewhere, you espouse German nationalist ideology and make comments about the superiority of the German ethnicity.
If it walks like a duck, and quacks like a duck…
OMG I am writing comments on how German infrastructure and urban planning are superior. What has this to do with being a Nazi? Seriously, just go away!
”
Second, critics ignore the more than $30 billion in highway user fees, including fuel taxes, vehicle registration fees, and tolls, that are diverted annually to transit and other non-highway programs. They should be counted as highway revenues even if legislators steal them for other programs.
” ~anti-planner
$30 billion…. ouch. That’s a hell of a lot to take out of funds that should be paying for what they were meant to pay for.
Define “user fees”.
MJ,
User fees are fees that people pay to consume or use a resource. When you buy something at a grocery store, that is a user fee. When a state imposes a sales tax on those purchases, those are taxes. When a state imposes an excise tax on gasoline and dedicates it to roads, it is a user fee. When a state imposes an excise tax on gasoline and dedicates it to transit or education, it is a tax.
In short, with a user fee, you get what you pay for. With a tax, someone else gets what you pay for.
Not sure I’m getting the distinction. Fuel taxes are also taxes, albeit excise taxes instead of sales taxes. But there is still some disconnect between the tax remittances of an individual user and the services provided. Not only is there a temporal delay between the remittance of the tax and the allocation of the revenue, but there is often no guarantee that the revenue collected will be spent in the same immediate jurisdiction. Federal fuel taxes are a more extreme example of this, where the revenues have just become a cash cow for an ever-increasing constituency of lobbying groups.
I don’t say this just to be pedantic, but to note that there are few hard-and-fast rules for defining user fees. Couple this with the even greater ambiguity with which the term ‘subsidy’ is often used, and you can easily see why so many of these “road subsidy” studies produce inconsistent and often contradictory results. I tend to view them more as rhetorical devices that reveal the leanings of the authors.