
Light rail is safe to ride, but it is one of the most dangerous forms of travel in the United States. That’s because most of the people who are killed by light-rail trains aren’t riding them; they are people struck by the trains. According to Federal Transit Administration (FTA) data, 657 fatalities have been associated with light rail since 2002, but only 20 of them were passengers on board the trains.
 Click image to download a four-page PDF of this policy brief.
Counting all fatalities, light rail was associated with 15.9 deaths for every billion passenger-miles that it carried. This is much higher than most other transit modes: buses were 4.9; heavy rail was 5.6; commuter rail was 7.6; and streetcars were 11.6. The only mode more dangerous than light rail was what the FTA calls hybrid rail, which is really light rail but powered by Diesels instead of electricity. It was associated with 20.6 deaths per billion passenger-miles.
The FTA publishes safety data in two different, somewhat complementary spreadsheets. The first, called safety and security time series data, reports fatalities, injuries, and other incidents from 2002 through 2021. It details who was killed or injured (passengers, people on platforms, employees, etc.), but does not say much about the incidents. The second, known as major safety and security events, has much more information about each incident but has data only from 2014 through 2021. For commuter rail, which isn’t included in the FTA data, I used National Transportation Statistics table 2-35, which has data through 2019.
My previous policy brief used the major events database to compare crime rates on various modes of transit. This week, I’m using a combination of these databases to focus on safety issues.
Suicides Count
I noted last week that the FTA counts suicides as a security issue, that is, a crime. Technically, that may be correct, but I deleted them from crime counts as I wanted to include only crimes that threatened other passengers.
For this analysis, I am counting suicides as safety events. The vast majority of people who commit suicide are severely depressed or suffer from some other potentially treatable mental illness. We have a network of suicide prevention hotlines and other services aimed at saving these people. We are building or modifying bridges with safety nets or fencing to deter suicides. Transit agencies shouldn’t undermine these efforts by designing transportation systems that make it easy for people to kill themselves.
In the past, when I’ve observed that most pedestrian traffic fatalities involve people crossing streets away from designated crosswalks, people have accused me of blaming the victims. Yet the same people are also quick to claim that we shouldn’t count suicides or even accidental fatalities from train collisions with pedestrians or automobiles because the people killed shouldn’t have been on the railroad tracks in the first place. Beyond the hypocrisy, my point is that both kinds of fatalities are design issues, and transportation planners need to be aware of how certain designs can make cities safer or more dangerous.
For example, the Regional Transit District (RTD) built a light-rail line on one-way streets in downtown Denver with the light rail going in the opposite direction of the rest of the traffic. Pedestrians thinking they only have to look one way before crossing the streets sometimes step into the path of light-rail trains and are hit. RTD has even been known to claim the pedestrians were suicidal, but this is a clear example of dangerous design.
I did note one exception among the suicide numbers. Last year, a San Jose light-rail employee killed nine of his co-workers at a light-rail maintenance center and then killed himself. I was surprised to see that one of the FTA databases counted all ten deaths as suicides. Naturally, I counted these as security, not safety fatalities. There may be a few others like this, but otherwise I added suicides to other safety-related fatalities to find out how safe or dangerous various modes can be.
Fatalities Per Billion Passenger-Miles
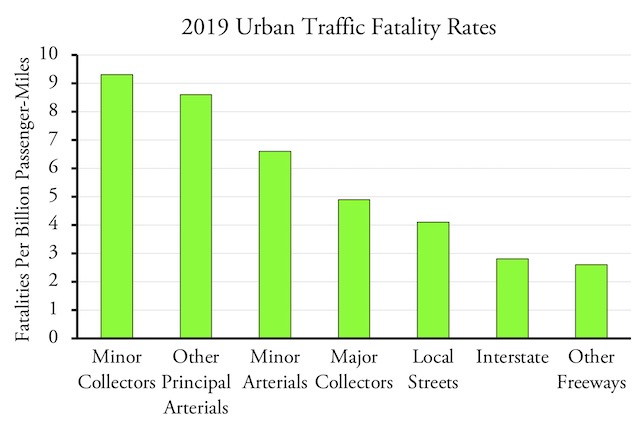
To compare modes, I counted fatalities against each billion passenger-miles carried by each mode. This can also be compared with traffic fatalities on various types of urban roads. Highway Statistics table FI-30 shows fatality rates per 100 million vehicle-miles by type of road; the latest table is for 2019. Table VM-1 indicates that the average motor vehicle has 1.72 passengers. I think that’s a little high, partly because I believe the Federal Highway Administration overestimates bus vehicle-miles and partly because I don’t count truck driver miles as “passenger-miles.” So I use 1.67, meaning that to convert to fatalities per billion passenger-miles I multiply FI-30’s rates by 10 and divide by 1.72.
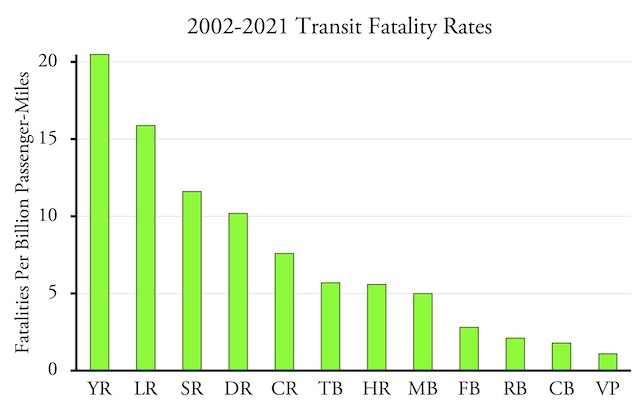
YR=hybrid rail; DR=demand response; FB=ferries; VP=van- pools; the rest should be self-explanatory.
The figure above shows that transit fatality rates range from 1.1 per billion passenger-miles for vanpools to 20.5 for hybrid rail. Note that the modes that are likely to spend much of their time on freeways—vanpools, commuter buses, rapid buses—tend to be the safest, while rail modes that are sometimes in or intersect with streets—hybrid rail, light rail, streetcars, and commuter rail—tend to be the most dangerous. For comparison, urban traffic fatalities range from less than 3 per billion passenger-miles for freeways to a little more than 9 for minor collector streets.
What Cities Are Most Dangerous?
Although light rail is, on average, more dangerous than heavy rail, there is a wide range within each group. Heavy-rail fatality rates range from just over 3 per billion passenger-miles in Washington DC to more than 20 in Philadelphia. Light-rail rates range from less than 2 in Boston to more than 60 in Houston and San Jose. That’s a huge range.
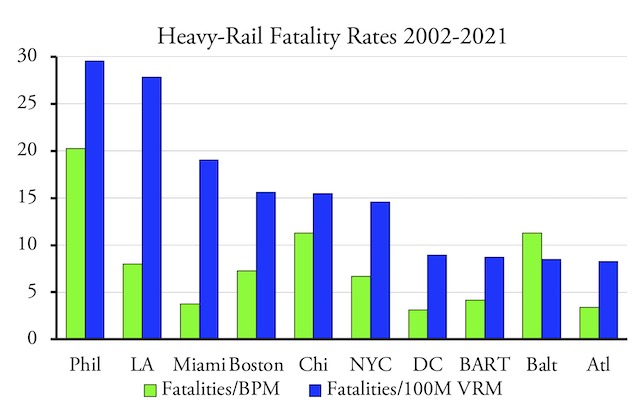
Philadelphia (SEPTA) heavy-rail lines are most dangerous on both a per-passenger-mile and per-vehicle-mile basis.
Since most light-rail fatalities take place outside the vehicle, I wondered if fatalities per billion passenger-miles would bias the results against agencies with low occupancy rates. Some light-rail systems carry an average of more than 30 passengers (that is, 30 passenger-miles per vehicle-revenue-mile) while others carry under 13. But, when measured in fatalities per hundred-million vehicle-revenue-miles, there is still a large range between cities: from under 9 to nearly 30 for heavy rail and from 5 to nearly 80 for light rail. (I used 100 million rather than a billion so that similar numbers could appear on the charts.)
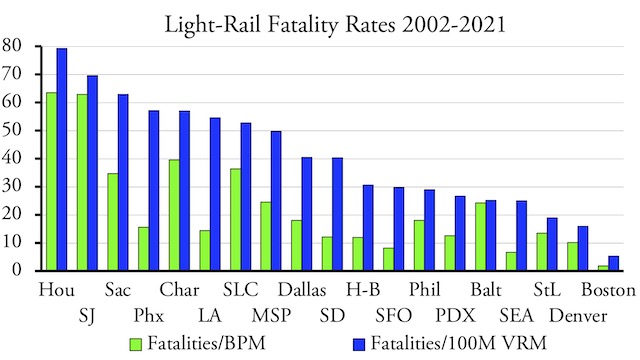
The differences between the safest and most dangerous light-rail systems are huge.
The safest light-rail systems are the ones that have the least street running and the most operations in their own rights-of-way. St. Louis light rail almost never runs in streets, Seattle’s in only a few spots, and Boston’s only in the outer suburbs. Houston’s and San Jose’s are almost entirely in streets.
It’s less clear what makes the difference for heavy rail. Why is Atlanta’s system so much safer than Los Angeles’? Why is Boston’s heavy-rail system more dangerous than its light-rail system? Some heavy-rail systems are older and so use different technologies, but that doesn’t seem to make a difference here: Philadelphia, Boston, and New York are all older yet have a wide range of fatality rates. Similarly, Los Angeles, Miami, Baltimore, and Atlanta are all newer, yet have an even wider range of fatality rates.
Trends
In 2008, a southern California Metrolink commuter train crashed head on into a Union Pacific freight train in Chatsworth, killing 25 people. In 2009, a Washington Metrorail train rear-ended another train, killing nine people. These two crashes led Congress to pass stricter laws, giving the Federal Railroad Administration authority to regulate commuter trains and the Federal Transit Administration to regulate other transit modes for safety purposes. If these regulations were successful, then fatalities from various modes of transit should have declined.
They didn’t. In the five-year period between 2015 and 2019, almost 10 percent more people died in commuter-train accidents than in the five-year period from 2004 through 2008. Almost twice as many people died in heavy-rail and light-rail incidents in the five-year period ending in 2021 than in the five years ending in 2009. The safety programs created by Congress may have increased agency costs and bureaucracy, but it doesn’t appear that they increased safety.
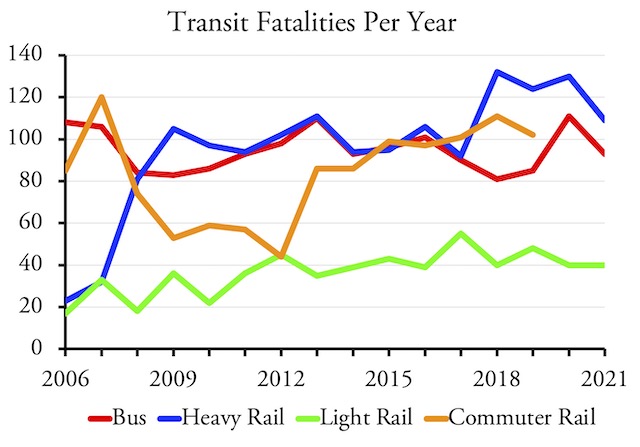
Fatality trends can be difficult to discern when examined on an annual basis.
Unlike highways that see literally trillions of passenger-miles of travel a year, it can be difficult to see trends in transit safety over short periods of time. Trolley buses, for example, have seen an average of one fatality per year while streetcars averaged two and hybrid rail three. But they might have four fatalities one year and then two years of no fatalities. Depending on which years are examined, it can look like safety is dramatically improving or declining. As the figure above shows, even when only major modes of travel are considered, the results can be erratic.
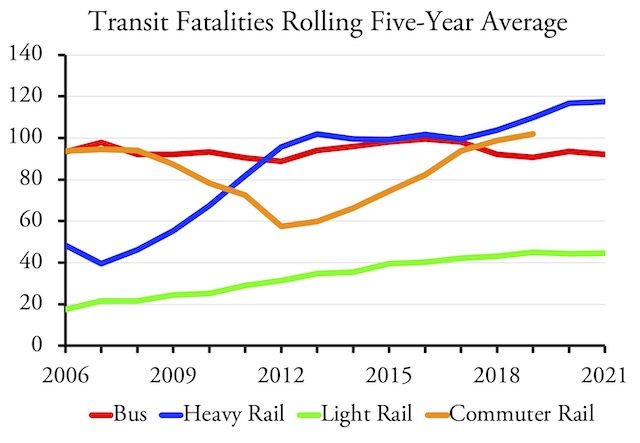
Trends are a little clearer when a five-year rolling average is used.
The picture becomes a little more clear when charting a rolling five-year average of fatalities. The figure below shows heavy-rail and light-rail fatalities have been increasing, bus fatalities have been steady, and commuter-rail fatalities were declining until 2012 but have been increasing since then. While it may be too early to tell, it appears that the pandemic neither increased nor reduced fatalities. Since ridership dropped, that means that fatality rates increased.
Making Transit Safer
Different prescriptions are required to improve transit safety depending on the kind of transit. Perhaps the most important idea that should come out of this is that cities should stop building light-rail transit.
Last week’s policy brief showed that light rail was highly criminogenic, meaning it attracted lots of crime. This brief shows that light rail, including Diesel-powered light rail, is also some of the most accident-prone form of transportation in the nation.
Unlike some forms of transportation, light rail has no redeeming values. It’s capacity to move people is much lower than buses. Most of the urban areas that have built it have seen no real increases in ridership except through population growth and transit’s share of commuting in those regions has remained constant or declined.
Some light-rail systems are safer than others, but only because the tracks are almost completely grade separated from autos and pedestrians. That gives them the high-cost disadvantage of heavy rail combined with the low-capacity disadvantage of light rail. Outside of New York City, buses should be able to handle the demand for transit ridership in almost every corridor in the country, so rail shouldn’t even be considered an option for new transit lines.
Making existing light-rail lines safer will be a huge chore. Some rights-of-way can be fenced, but that’s not possible when they are shared with other motor vehicles. Replacing at-grade crossings with underpasses or overpasses will be expensive and not really worth it considering that there are so many grade crossings that the chances of a fatal accident at any one of them are low. The best thing that safety-conscious planners can do is take up the rails as they wear out and replace them with buses.
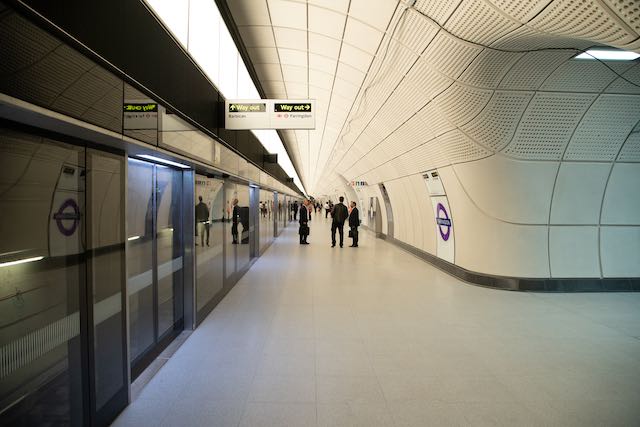
Platform screens at Farringdon Station on the London Crossrail line. Photo by Tom Page.
Heavy rail is easier. Close to 45 percent of heavy-rail fatalities are considered suicides, compared with only a quarter for light rail. The solution is to build protective screens between the trains and platforms with doors that open only when a train is standing in the station. Such screens will also protect people from being shoved onto the tracks and help keep people out of subway tunnels. Almost every airport train in the country has such protection for passengers, as well as many subway lines in Europe and Asia. None of the heavy-rail systems in the United States use them, but New York’s MTA just announced it would test them at three subway stations.
Unfortunately, the Federal Railroad Administration doesn’t publish system-by-system commuter-rail safety data. However, it is likely that most commuter-rail accidents are at grade crossings. One simple solution is to install crossing gates that cover the entire roadway, and not just the lanes of traffic heading towards the crossing. Such gates will discourage people from going around the gates and being struck by trains. This should also be done for other forms of rail transit.
Bus transit is safer than almost any mode of rail transit, but it can be made safer still. The easiest way is to buy smaller buses that are less likely to crush other vehicles or pedestrians in accidents. Transit agencies have had an unfortunate buy-bigger mentality stimulated by the federal government’s willingness to pay up to 90 percent of the cost of new buses and the naïve belief that operating costs are limited to the cost of paying the drivers. In many cities the buses run mostly empty most of the time, so large buses are not really needed, especially considering that post-pandemic ridership is not likely to recover to pre-pandemic numbers.
Safety should be the number one priority for transportation planners, but it clearly isn’t or more than 20 transit agencies would not have built new light-rail/hybrid-rail systems since 1980. Too many transit officials are willing to blame the victims for the high fatality rates associated with most rail transit when the real problem is the design flaws inherent in the transit systems they insist on building. It is time to end this near-complete avoidance of the safety issues associated with public transit.


657 since 2002….wow. Thats literally 1 person a month.
By contrast auto related deaths killed 600,000. If we wanted to make cars infinitely safer they’d be tanks…..but gas mileage would be so horrible.
Volvo earns it reputation….Volvo XC90, according to Thatcham Research. NOBODY has ever died in a Volvo XC90 in the UK since the first generation model launched in 2002.
Tesla model 3 is the Only US sedan to get 5 stars in all crash rating………
“Speed Kills”, it’s not just what Annie muttered to Michael Myers before getting her throat slashed.
Data published by AAA Safety Foundation to chart the statistical likelihood of survival as motorist speed increases.
Why does Europe have such fewer pedestrian deaths…
Simple
1: Lower speed limits
2: Lighter but tougher cars
3: Massive public effort to make cities liveable, places for residents
4: Since there’s less crime, Police devote their efforts to safety/enforcement.
5: Most important: Europe didn’t heavily adopt bicycle and pedestrian infrastructure because they care for the environment; that’s side circumstance. They did it because of energy crisis they’ve been battling for 7 decades.
How many of those light rail deaths were result…of car drivers and pedestrians who thought they could beat the system….. or namely portal light rail as dangerous because it’s a dangerousventity….or because stupid people think they aren’t liable.
Guy sticks his hand in a blender…..do we suddenly say blender Is “The most dangerous of kitchen equipment”…
Walt Disney wirlds Monirail at 14.7 miles long serves 150,000 daily passengers and has moved close to 1.5-2 billion since 1971….and ran for 50 years….without major overhauls except Train replacement…… and had a grand total of 9 fatalities most of which were people’s fault.
Nor has ever derailed…and only had one fatal collision…..
Truly is safest way to go….
But ehhh you wouldn’t be interested… it’s more of a Shelbyville idea…
Things that make elevators, airplanes and Disney’s monorail safe could be applied to other modes — grade separations, doors blocking access and attendants — but are not inexpensive. Capital, maintenance and labor costs apparently make them uneconomical.
Re: The Disney Monorail
Most real transportation at Orlando Disney World is supplied by Disney’s very efficient, safe, reliable and flexible bus system. Disney also has horse-drawn streetcars, but few are advocating for more of those.
”
In the past, when I’ve observed that most pedestrian traffic fatalities involve people crossing streets away from designated crosswalks, people have accused me of blaming the victims. Yet the same people are also quick to claim that we shouldn’t count suicides or even accidental fatalities from train collisions with pedestrians or automobiles because the people killed shouldn’t have been on the railroad tracks in the first place. Beyond the hypocrisy, my point is that both kinds of fatalities are design issues, and transportation planners need to be aware of how certain designs can make cities safer or more dangerous.
” ~anti-planner
IMHO they’re pulling the all lives matter stunt. We have a specific issue we’d like to focus on, explore and improve. Instead of helping, they pop in to undermine the effort with their whataboutisms and wheatever other knee jerk reaction they inflict on the world.
”
NOBODY has ever died in a Volvo XC90 in the UK
”
No one buys the ( ugly ) XC90. Less than 2,000 were sold in all of Europe in January. That’s essentially zero, none, nada, bupkis.
Any perception of safety with the XC90 based on outcomes is primarily driven by their rarity.
LazyReader,
You are really living up to your name today. Look at the first two charts. Cars are safer than light rail. Yes, more people have died in auto accidents, but Americans travel more than 4 trillion miles a year by auto and fewer than 2.5 billion miles a year by light rail.
By your logic if we “Drive fewer miles” will the per capita deaths by driving will go down….
The Antiplanner states casualties by car are less proportionally than rail. Per 100 million passenger miles………
Thing about per capita statistics, they mean little, but they are a decent reference to make the case seem more severe. Population bias ruins statistics.
Alaska isn’t the haven of violent crime we think……but in terms of proportion they have more violent crime? Alaska had 41 murders in 2018, California had over 1,900……..But Alaska is the more dangerous State?….per capita, even thou more likely to die by a polar bear than being shot by a crip.
Transit safety is administered by Government, as most transit agencies are now Government agencies… Where as automobile safety is administered by the individuals driving, MILLIONS of them. Suicide by light rail seems a popular way for someone to end their lives. If there are federal statistics that remove suicides from the total number of fatalities “caused” by light rail I haven’t seen them. As matter of fact; the Federal Transit Agency didn’t count suicides in death counts until 2002. Secondly; the popular usage of fatalities divided by vehicle miles is a poor equation to compare the safety of various transit modes. Light rail, unlike other forms of rail like commuter or long distance; and bus service, runs near exclusively in urban areas corridors. Dense areas that have more accidents anyway….accidents even where cars are going HALF as fast as highway typical speeds. 3rd: They include grade crossing incidents which unfairly increase the numbers. Lastly, another problem is small sample size, Since light rail is occupying urban areas, is driving statistics also confined to geographic area light rail serves?…..Keep this in mind the next time a high-profile train crash generates press coverage far more than a year’s worth of car wrecks that kill thousands.
”
By your logic if we “Drive fewer miles” will the per capita deaths by driving will go down….
” ~lazyReader
There’s nothing logical nor reasonable about what you’re saying. Nothing.
Worse, we’re looking to explore how to make something safer. And like a toddler you’re just getting in the way with your screeching tantrums about something you don’t like.
Not constructive. Not logical. Not reasonable.
We should be get rid of the outmoded per-capita method of comparing deaths and use the per-unit consumed method that the Antiplanner advocates for transportation-related deaths.
For example, although the U.S. has almost 30 times the per-capita homicide by firearm rate compared to the Netherlands, when you look at deaths per bullet fired, the countries have about the same rates of death.