
About 5.0 million Americans relied on transit to get to work in 2022, according to American Community Survey data released by the Census Bureau last week. This is more than the 3.8 million people who took transit to work in 2021, but far less than the 7.8 million to used transit in 2019. People who used transit represented 3.1 percent of the workforce, up from 2.5 percent in 2021 but down from 5.0 percent in 2019.
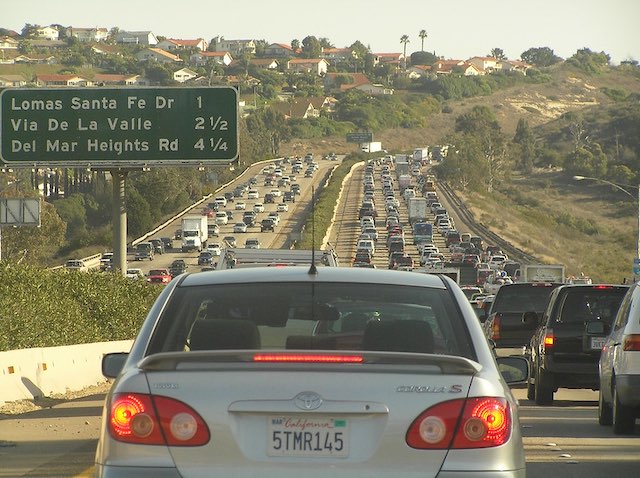
There was about 6 percent more commuter traffic on the roads in 2022 than 2021, but still about 7 percent less than 2019. Photo by Tomi Knuutila.
Transit’s share is strongly skewed by New York City, which housed 2.5 percent of the nation’s workers but 34.6 percent of the nation’s transit commuters in 2022. Outside of New York City, only 2.1 percent of workers relied on transit to get to work in 2022. That’s just the city: the New York urban area had 45.4 percent of the nation’s transit commuters, and outside of that area only 1.8 percent of workers relied on transit.
About 4.4 percent of workers lived in households with no cars in 2022, up from 4.1 percent in 2021 and 4.3 percent in 2019. Of the workers in households with no cars, more than 25 percent drove alone to work (mostly in employer-supplied vehicles) and 9.5 percent carpooled while 27.6 percent took transit. This, too, was skewed by New York City; in the U.S. outside of New York City, 33.1 percent of people with no cars drove alone to work, 12.1 percent carpooled, but only 17.4 percent took transit.
Meanwhile, 15.2 percent of workers worked at home in 2022, down a bit from 17.9 percent in 2021 but well above 2019’s 5.7 percent. While New York City dominated the nation’s transit ridership numbers, no place in particular dominated telecommuting, but the range of telecommuting by state or region was wide.
Frisco, Texas, a suburb of Dallas, was the community with the most telecommuting, at 39.7 percent. I have no idea why that is, but the second-most, Bellevue Washington, at 38.5 percent, is more obvious, since a lot of Microsoft and other high-tech workers are there. Other cities with more than 35 percent remote workers include Seattle, Berkeley, Arlington VA, San Ramon CA, and Fremont CA.
Washington DC, at 33.8 percent, wasn’t far behind. The federal government is trying to get people to return to offices, but not having much better success at it than private employers.
On a state-by-state basis, Colorado had the most telecommuting at 21.2 percent, followed by Washington at 20.5 percent. The least was in Mississippi, which is last at so many things, at 5.5 percent.
Rural areas (such as much of Mississippi) are likely to have fewer people work at home. The share of remote workers in the 203 urban areas in the survey was 17.5 percent while the rest of the country (some of which was urban) was 10.9 percent. Among the 50 largest urban areas, Austin, Charlotte, Raleigh, San Francisco, San Jose, and Seattle all had more than 25 percent of workers staying at home. The lowest among the 50 largest urban areas was Riverside-San Bernardino at 10.0 percent.
The 172 percent increase in working at home since 2019 had the greatest impact on transit. The number of people who drove alone to work fell by 7.5 percent, carpoolers by 0.1 percent, walking by 7.2 percent, and bicycling by 9.2 percent, but the number of transit commuters fell by 35.6 percent. Taxi (which includes shared rides such as Uber and Lyft) fell by only 0.9 percent.
Since the survey reports the number of people in 2, 3, 4, 5 & 6, and 7+ carpools, it is possible to estimate the total number of vehicles used for commuting. (I used 5.5 for the 5 & 6 category and 7 for the 7+ category — the exact numbers in these categories aren’t too important because so few people are in those groups.) The result was 116.4 million in 2022, up from 110.0 million in 2021 but down from 125.4 million in 2019. Thus, roads were a little more congested than in 2021 but still less than in 2019.
You can download any of these data from the American Community Survey website. Enter the number of the table you want in the search field, then choose the geographic area you want, then click on “View all 30 products” under Tables. For 2022 numbers, click on “2022: ACS 1-year Estimates Detailed Tables.” Download the data in Excel, CSV, or other format by clicking on “More tools” on the right. If you choose a lot of geographic areas, such as all cities and counties, the web page may report that there are too many data to display and ask if you want to download. My experience is this never works; instead, choose, “To proceed with the table display anyway, open the table” then choose Excel or CSV file under the “More tools” menu.
Some of the tables you may want to examine include:
• B08301 – Means of transportation to work
• B08119 – Means of transportation to work by income
• B08121 – Median income by means of transportation to work
• B08141 – Means of transportation to work by number of vehicles in household
• B08203 – Workers by number of vehicles in household
• B25044 – Tenure by number of vehicles in household
If you select a number of geographic areas for one table and want to see the results of another table for those geographic areas, you can just substitute the new table number for the old one in the URL. Confusingly, the URL shows the table number twice, once in the middle and once at the end; changing the one the end is sufficient to get the new data.
Tomorrow I’ll present some of the results of the American Community Survey pertaining to housing.


Sum up Transit
2022, Total transportation spending was 280 billion dollars
Roads/highways/etc. got 200 billion
Transit got 80 Billion.
Transit spends 80 billion to move 5 million people that’s 16 thousand per person per year, 43 dollars a day
The Bipartisan Infrastructure Deal provided $89.9 billion in guaranteed funding for public transit over five years. (https://www.whitehouse.gov/briefing-room/statements-releases/2021/11/06/fact-sheet-the-bipartisan-infrastructure-deal/)
That’s $17,980 billion per year and $3,596 per person per year; $9.85 per person per day.
The rest of the story:
Let’s assume only 80 percent of the population takes one highway trip per day. (I think it’s closer to 95 percent but let’s be conservative.) That’s 272 million people.
The Bipartisan Infrastructure Deal provided $110 billion for roads and bridges over 5 years. That’s $22 billion per year and $81 per person per year; $0.22 per day.
But that’s not the end of the story. Highway users pay highway user taxes. Well, most of them do, anyway. There is no such thing as a “transit user tax”.
It should be important to note the space saved by transit in the form of parking lots. Parking lots provide very little land value in comparison to actual buildings, which means low property taxes. Car-centric planning encourages more parking lots, to the point where 22% of area in american cities is parking lots. That is a LOT of lost tax revenue at pretty much every level. It should also be noted that america has no HSR at all (or at the very least extremely little), which means the only options to traverse between cities is a slow and thus expensive diesel (because god forbid the fed sink money to put some wires above the rails) rail system, the subsidized airline industry, or the government owned highway system.
First, the city taxes land and improvements.
Second, citizens do not have a duty nor a goal of maximizing tax revenue for cities. The city can have higher taxes by simply increasing the tax rate.
Third, it is completely asinine to try to mandate improvements the market simply does not support. The city does not own the property. If the property had a higher and better use for the OWNER then the owner would already have an incentive to do so. In the end it must remain the owner’s choice unless the city wants to PAY to take the property via eminent domain for public purpose.
Fourth, there is no “lost tax revenue”