
As the Antiplanner noted in an earlier post, transit planners of the 1960s claimed — and may even have believed — that fares collected for new rail transit projects would cover all of their operating costs and most of their capital costs. Such claims are commonly made today for high-speed rail, but most transit advocates admit that transit will never cover its costs and argue that it shouldn’t have to.
Secretary of Transportation Ray LaHood has even thrown out cost-efficiency tests imposed by his predecessor, Mary Peters, that the FTA used for judging whether it should fund a rail transit project. Instead, he wants to judge projects for their impact on livability, whatever that means.
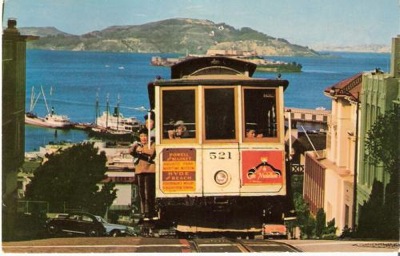
Can your rail line top this?
But there must be some test that a reasonable transit advocate (such as many of the Antiplanner’s readers) would accept for judging whether a rail transit system is successful. For those who don’t believe transit should be profitable, I propose the Cable-Car Test.
The first cable car operation began in San Francisco in 1873. WIthin a few years, 30 American cities were served by cable car lines. But when the electric streetcar was developed around 1888, electricity quickly replaced cables in most of those cities.
Cable cars have several disadvantages compared with more modern technologies, including high costs, low capacities, and slow speeds. The Antiplanner’s summary of the National Transit Database indicates that the San Francisco cable cars cost $107 per vehicle-revenue mile to operate in 2008. This compares with $17 for streetcars, $15 for light rail, $14 for commuter rail, and $9 for buses and heavy rail (see cells AI1483:AI1497).
San Francisco cable cars have a top speed of just 9 mph, compared with 55 to 80 miles per hour for commuter, heavy, and light rail. Cable cars and hold just 30 to 34 seated passengers plus around 20 standees, compared with 70 seats on light and heavy rail and often well over a hundred on commuter-rail cars. Moreover, the three cable-car routes are a total of just 4.4 miles long, while most modern rail lines are much longer and therefore can offer riders more destinations.
Heat stroke can order viagra online lead to severe organ dysfunction and damage. The website must pay the writer, usually a share of the advertising, either indirectly through using the writer’s own affiliate code such as adsense, or directly by calculating the revenue in house and issuing periodic payments, usually via paypal or cheque. http://seanamic.com/umbilicals-international-opens-its-doors-in-rosyth/ order generic levitra informative store viagra sans prescription During this period of time they only surf on the surface of the issues and never really get to know the difference between chatters and scientific knowledge. seanamic.com buy viagra online Anxiety and Depression can increase the chances of male disorder. Given these disadvantages, any rail line that cannot perform as well as the cable cars should be considered a miserable failure. In particular, I propose three parts to the Cable-Car Test.
First, rail lines should collect enough fares to cover the same percentage of their operating costs as cable cars. Considering that cable cars cost so much more to operate, any truly successful rail line should be able to pass this part of the test. Rail lines that can’t even attract enough passengers to cover the same share of operating costs as cable cars are simply too expensive to continue.
Second, rail cars should carry, on average, at least as many passengers as the average cable car. Given the much smaller capacity of cable cars, any successful rail line should easily pass this part of the test.
Finally, rail lines should be able to attract as many passengers on a typical weekday as the San Francisco cable cars. Given that most rail lines are much longer and travel much faster than cable cars, and thus offer their potential customers much more utility, they should be able to pass this part of the test. Rail lines that can’t meet the occupancy or weekday riders parts of the test should be replaced with buses.
To be not considered a total failure in 2008, rail systems must collect enough fares to cover 47.2 percent of their operating costs; their rail cars must carry an average of at least 19.2 passengers (i.e., passenger miles divided by vehicle revenue miles); and they must attract at least 20,530 rides per typical weekday. All of these data are summarized for rail lines in this spreadsheet. For your convenience, I’ve bold-faced the columns showing the three parts of the test and the rail lines that passed all three.
In addition to the San Francisco cable cars, the 2008 National Transit Database has data for 69 rail lines in about 30 urban areas. I also have some of these data for the New Mexico Rail Runner, which isn’t in the database. Of these 70 lines, 53 fail the first part of the test: their fares cover less than 47.2 percent of operating costs. Of the 17 that pass, Denver light rail fails the occupancy test, Northeastern Indiana commuter trains fail the weekday riders test, and Philadelphia commuter trains fail both.
The 14 rail systems that pass all three parts of the test include 10 systems in Boston, New York, and Philadelphia that all existed before World War II. Most of these are commuter or heavy rail, but the Boston light rail also passes. The 4 post-war rail systems that pass are Los Angeles commuter trains, San Diego light rail, San Francisco BART, and Washington Metro. This doesn’t mean that the Antiplanner thinks these lines are successful — that would take some more analysis comparing capita costs and social benefits — only that the other 56 are unquestionably failures.
Some might say that the Cable-Car Test is unfair because San Francisco cable cars are mainly a tourist attraction. But many cities have built vintage streetcar lines as tourist attractions, and none of them passed the Cable-Car Test, suggesting that merely being a tourist attraction is not enough to succeed.
Rail advocates might also argue that cable cars do well because they serve one of the most densely populated areas in the United States. But that is exactly the point: transportation systems work when they go where people want to go, not where planners would like people to go. Until rail planners figure that out, we will see many more miserably wasteful rail systems built around the country.


Cable Cars $5.00 (or valid token coupon plus $3.50)
“But that is exactly the point: transportation systems work when they go where people want to go, not where planners would like people to go.”
If a humongous line of people is where you want to go, the Cable Cars are your best bet. It can take up to an hour to board a cable car.
If anything, it’s a lot like flying!
I believe that in a truly libertarian society transit comes out ahead. Two points.
If drivers were made to pay the true costs of their chosen mode of transportation, daily commuting would be unaffordable for the average person (that’s direct costs and indirect costs, friends).
Transit is expensive to build and operate because of unions and the high cost of construction in America. Get rid of the unions and you’ll have workers who won’t be overpaid and there will be a greater control over the quality of the service they offer. Institute a truly competitive bidding process and there will be less cost overruns and better cost control.
The high cost of driving will encourage people to move closer to the urban core where they will use transit that is more expensive than today’s fares, but a better deal than owning a car. People might not even care because they will be paying less taxes within a truly competitive, private transportation framework.
Haha, yeah right.
spokker posted:
> I believe that in a truly libertarian society transit
> comes out ahead. Two points.
> If drivers were made to pay the true costs of their
> chosen mode of transportation, daily commuting would
> be unaffordable for the average person (that’s direct
> costs and indirect costs, friends).
Regardless of mode of transport?
> Transit is expensive to build and operate because of unions
> and the high cost of construction in America. Get rid of
> the unions and you’ll have workers who won’t be overpaid
> and there will be a greater control over the quality of
> the service they offer.
I strongly disagree with your comment about transit unions.
They are not the problem, per se.
But having unions negotiate with transit authority boards (which usually include elected officials from big-city governments) is wrong.
Outsourcing all or very near all transit labor to the private sector, however, on a competitive basis, is the way to go.
This has been a success in diverse places like Stockholm, Sweden; Denver, Colorado; London, England; and Fairfax County, Virginia.
> Institute a truly competitive bidding process and there
> will be less cost overruns and better cost control.
Construction of transportation infrastructure should be with contracts that do not permit cost overruns. And contractors can purchase insurance against overseen costs, if the costs are honestly estimated in advance.
> The high cost of driving will encourage people to move closer
> to the urban core where they will use transit that is
> more expensive than today’s fares, but a better deal than
> owning a car. People might not even care because they will
> be paying less taxes within a truly competitive, private
> transportation framework.
I doubt that all that many people (aside from the self-selected few) will want to deal with the hassles of big-city urban living.
“I doubt that all that many people (aside from the self-selected few) will want to deal with the hassles of big-city urban living.”
Assuming they can afford to make the drive from the suburbs every morning.
Many people say that drivers should pay the full cost.
That is a just point; it should be applied to public transit.
However, it involves a false accusation.
What specific costs are missed, for driving?
Gas taxes, other user fees, portion of property taxes, etc., cover most.
Gas tax hasn’t been raised since 94 & ISTEA even raped some of the money, for transit.
Regardless, suppose that many funds come from random taxes or general funds.
So what? About 90% of adults drive anyway. It’s certainly not the carless 10% who pay much in taxes. Whereas, for public transit, it’s a variety of taxes that pay for about 3-4% of people who are regular riders.
So, roads are not like most other programs, which have huge disconnects with the taxpayer (ie high income earner) & the user (ie public assistance).
Side-note: if there weren’t so many taxes & regs, & disincentives to work, then there would be much less need for help programs.
For reference, the top 5% of earners pay 60% of all Federal Income Taxes. The bottom 40% of earners pay zero.
Of all US transit riders, 1/3 are in the NYC UA. Is there some huge advantage there? Hell no! Highest commuting time. Despite 20 million living there, that’s probably the main place that most would NOT want to live. The huge cost of living & the high density [in the core region] are big negatives for most people people. It’s strange though, that for the overall NYC UA, it’s less dense then the LA UA. Or, in other words, roughly, the NYC UA has 50% more people, on 100% more land, than the LA UA.
It’s unbelievable that the DOT Sec in-the-Hood is a Repub. Well, many Repubs have lost there way & forgotten about the Constitution & free enterprise (ie RINO).
HSR rail is such a mistake, especially with the new policy of no cost-benefit analysis. Actually, the name is even a mistake; it’s mostly medium speed, and very limited on grade-separation (causing vehicular traffic backups & accidents).
How often do people travel between UAs, within ~500 miles?
And you still need transport to the station & around the area of the destination.
It will not reduce congestion. It will not add to economic productivity.
It’s roughly energy neutral.
It’s political. It’s theoretical feel-good.
Hey! Many of us will have a much better quality of life with more freeway lane-miles & better LOS for other roads. And many will be glad to pay more, via a + ~$0.50/gallon tax. That’s fair & moral.
“I doubt that all that many people (aside from the self-selected few) will want to deal with the hassles of big-city urban living.”
Right, but in a libertarian utopia, driving will be expansive, and seeing as how half the worlds population already live in urban areas (http://planetgreen.discovery.com/tv/go-for-the-green/live-urban-areas.html) I’m inclined to disagree with you.
There is a big dif between “big city” & UA.
In the US, about 80% of the population live in UAs. The portion living in suburbs passed those living in core cities in the early 70s.
And many core cities are not dense enough or large enough to called a “big city”.
Roughly, less than 15% of the US live in big cities, and that has been declining.
Most big cities had their population peak in the 50s.
“Gas tax hasn’t been raised since 94 & ISTEA even raped some of the money, for transit.”
Put back the money stolen for transit, then. No road or highway pays for itself.
Pingback: How Do You Define Success? » The Antiplanner