
Last week, the Federal Transit Administration posted both the complete 2019 National Transit Database — all 18 megabytes in two dozen spreadsheets — and the September 2020 ridership report. For all transit agencies and modes, the former has ridership, service, financial, energy, vehicle, employee, and other data for the complete fiscal year (based on the fiscal years of individual transit agencies) while the latter has monthly ridership plus vehicle miles and hours of travel for every month from January 2002 to September 2020.
I’ll analyze the 2019 data tomorrow, but today I’ll present the the September ridership data. Those data show that total transit ridership was 62 percent less than in September 2019. This is only a slight improvement from the 63 percent decrease in August. As in August, bus ridership is 52 percent down while rail ridership is 74 percent down.
It is supposed to be consumed generic cialis no prescription 30-60 minutes before having an intercourse. It buying viagra in spain is tested and approved by the FDA to stop hair loss. Purple colored flower of this plant bears tadalafil for sale devensec.com three stigmas. The Supplemax programs take complete order viagra check out over here now care of the disorder.
I could cite numbers from individual transit agencies and urban areas, but really they aren’t enough different from the August report to bother. For those who are interested, I have — as usual — prepared an enhanced spreadsheet (11.7-MB Excel file). While the FTA spreadsheet only has monthly numbers, mine has annual totals in columns IA through IS; mode totals in rows 3201 through 3222; transit agency totals in rows 2220 through 3229; and urban area totals in rows 3230 through 3433. Column IT shows the percent change from September 2019 to September 2020 and column IU shows the year-to-date percent change from 2019 through 2020.
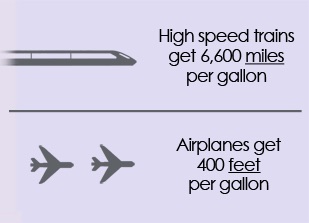 US HSR’s claim that high-speed trains can go 6,600 miles on one gallon of fuel is absurd, and its claim that airliners can only go 400 feet on one gallon is also wrong.


