Repeating History

In 1947, the U.K. Parliament passed the Town & Country Planning Act, which limited urban development to 6 percent of the land area of the country. Housing soon became expensive. Politicians responded by promising to build lots of new housing, mostly high-rise but some mid-rise.

The new housing proved to be a disaster. It created lots of social problems including crime and congestion. Much of the housing was also poorly built. Meanwhile, housing affordability continued to decline. Today, only the upper classes own their own homes while most working-class Brits live in “council housing.” Continue reading

Miami Affordable Housing Vice

By Elijah Gullett

Note: As a follow-up to my report on low-income housing tax credits in Seattle, I asked Elijah Gullett, who is a student in public policy at the University of North Carolina in Chapel Hill, to look at affordable housing programs in Miami. This is his report.

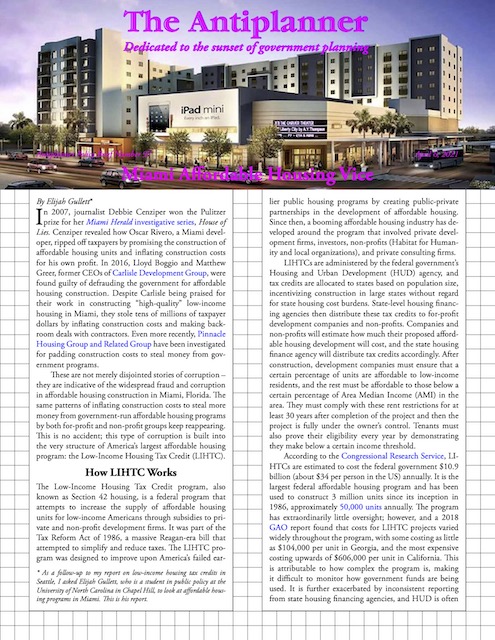
Click image to download a five-page PDF of this policy brief.

In 2007, journalist Debbie Cenziper won the Pulitzer prize for her Miami Herald investigative series, House of Lies. Cenziper revealed how Oscar Rivero, a Miami developer, ripped off taxpayers by promising the construction of affordable housing units and inflating construction costs for his own profit. In 2016, Lloyd Boggio and Matthew Greer, former CEOs of Carlisle Development Group, were found guilty of defrauding the government for affordable housing construction. Despite Carlisle being praised for their work in constructing “high-quality” low-income housing in Miami, they stole tens of millions of taxpayer dollars by inflating construction costs and making backroom deals with contractors. Even more recently, Pinnacle Housing Group and Related Group have been investigated for padding construction costs to steal money from government programs. 

Continue reading

Housing Affordability and the Pandemic

The median price of homes in Auckland, New Zealand’s largest city, grew by $100,000 in February, reports the Real Estate Institute of New Zealand. That means prices were growing by $25,000 a week. The good news is that these are New Zealand dollars, which are only worth about 72 cents U.S., which means prices grew by “only” US$18,000 a week. The bad news is Auckland’s median prices had already reached $1 million (U.S.$720,000) in January, so February’s price increase was only about 10 percent.

Click image to download a four-page PDF of this policy brief.

Like many American cities with sky-high housing prices, Auckland has an urban-growth boundary, locally known as the Metropolitan Urban Limit, which it adopted in 1998. Advocates claimed that this limit would reduce transportation, utilities, and other costs. Ten years later a former Auckland city planner could only say that the limit was successful because it contained growth within the limit. That’s like saying schools are successful because they contain children. Continue reading

Making Housing Less Affordable

The Colorado legislature is considering a bill to allow cities to require developers to provide “affordable housing” in their developments. This is called “inclusionary zoning.” Such requirements have three effects.

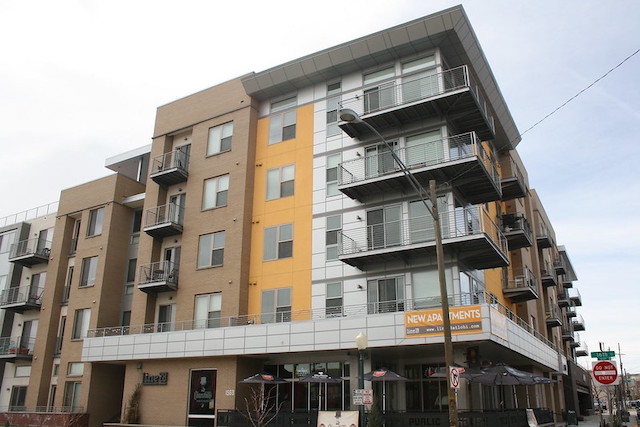
This five-story building is typical of the new housing being built in Denver. It has 871-square-foot one-bedroom apartments for rent for $2,400 to $3,600 a month. Someone would need an income of nearly $100,000 a year to afford one. Inclusionary zoning would make it even more expensive. Photo by Jeramey Jannene.

First, developers respond to the higher costs by building fewer units of housing. Second, to pay for the units they have to sell or rent at below-market rates, they raise prices on the market-rate units. Third, existing home sellers or landlords, seeing that new units are going for higher prices, raise their prices as well. Voila! Inclusionary zoning makes housing less affordable. But don’t believe me: here’s a paper that proves it using real-world data. Continue reading

The Myth of Exclusionary Zoning

Jerusalem Demsas, a writer for Vox, thinks people should “sue the suburbs” to eliminate their exclusionary zoning, meaning single-family zoning. Her example is Franklin, Tennessee, a suburb made well-off by the location of North American corporate headquarters for both Nissan and Mitsubishi.

As a result, the median home price in Franklin is higher than nearby Nashville. Demsas blames that on exclusionary zoning. But incomes in Franklin are higher than Nashville; when compared with incomes, Franklin housing is actually more affordable than Nashville’s. Considering all of the businesses located in Franklin, it is only a suburb in the sense that it is near Nashville, not in the sense that huge numbers of commuters pour into Nashville from Franklin every morning.

Demsas says that Franklin’s relatively small share of multifamily housing is evidence of exclusionary zoning. In fact, it is just evidence that when people get enough income, they prefer to live in single-family housing. Using 2019 American Community Survey data for more than 500 cities across the country, there is almost no correlation between the percentage of housing that is multifamily and the affordability of housing in those cities (correlation = 0.3 where 1 is perfect and 0 means no correlation). Continue reading

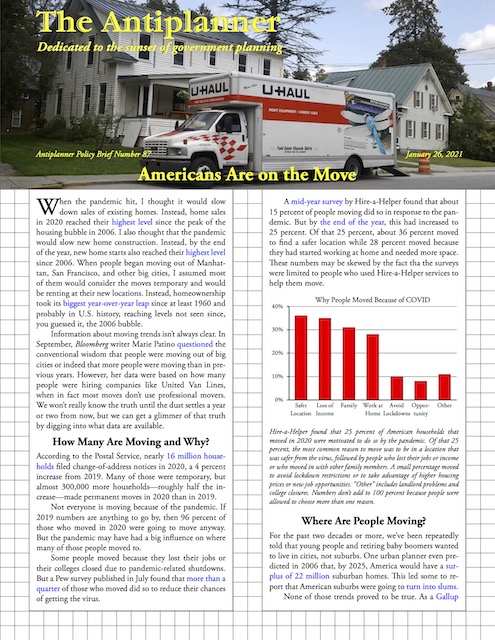
Americans Are on the Move

When the pandemic hit, I thought it would slow down sales of existing homes. Instead, home sales in 2020 reached their highest level since the peak of the housing bubble in 2006. I also thought that the pandemic would slow new home construction. Instead, by the end of the year, new home starts also reached their highest level since 2006. When people began moving out of Manhattan, San Francisco, and other big cities, I assumed most of them would consider the moves temporary and would be renting at their new locations. Instead, homeownership took its biggest year-over-year leap since at least 1960 and probably in U.S. history, reaching levels not seen since, you guessed it, the 2006 bubble.

Click image to download a three-page PDF of this policy brief.

Information about moving trends isn’t always clear. In September, Bloomberg writer Marie Patino questioned the conventional wisdom that people were moving out of big cities or indeed that more people were moving than in previous years. However, her data were based on how many people were hiring companies like United Van Lines, when in fact most moves don’t use professional movers. We won’t really know the truth until the dust settles a year or two from now, but we can get a glimmer of that truth by digging into what data are available. Continue reading

Idaho Is Roaring

“Had someone asked me in March,” wrote economist Megan McArdle in September, “I would have predicted that after six months of pandemic, the housing market would be full of panicked people frozen in their homes, except for those who were being evicted. Instead, the housing market is roaring.”

It continues to roar today. As the Economist observes, those roars are fed by low interest rates, government cash handouts, and a desire of many to move to homes suitable for telecommuting.

Of course, some housing markets are roaring louder than others. As CNN notes, “home prices are rising faster in the middle of the U.S. as Covid drives people away from coasts.” CNN cites home price index data published by the Federal Housing Finance Administration. Continue reading

Another Phony Housing Crisis

The Wall Street Journal recently published an op-ed piece about “the housing crisis that is plaguing rural America.” Using Orange County in southern Indiana as an example, the writer, Kerry Thompson, frets that “There simply isn’t enough housing for the people who want to live there,” which is “having a devastating effect on rural America’s economy.”

Evidence of a housing crisis? This 2,900-square-foot home in rural Orange County, Indiana is currently for sale for $265,000, or $91 per square foot. A Wall Street Journal op-ed somehow argues that this low price is evidence of a rural housing shortage. Note the Trump banner; I suspect this is really evidence of the divide between urban and rural areas, as the Journal writer doesn’t seem to understand rural areas despite running an organization that is supposedly devoted to rural problems.

This is a problem, Thompson claims, because the pandemic has led to “upticks in interest in rural areas, as more Americans determine to flee the cities for greener pastures.” If there is a rural housing crisis, there may not be any greener pastures for them to move to. Continue reading

Fixing Federal Affordable Housing Programs

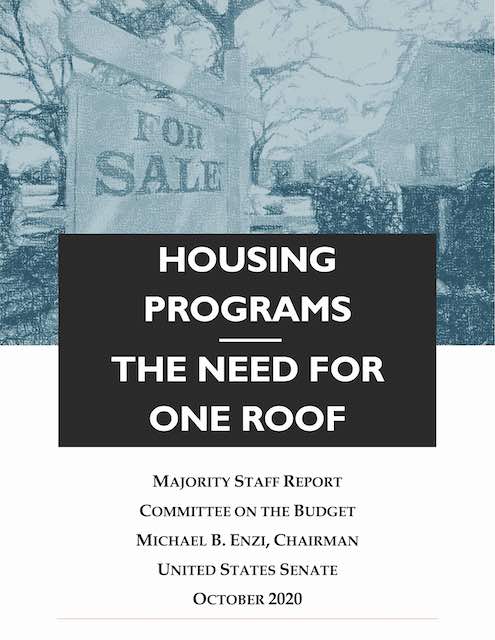
The federal government has 160 different housing programs run by at least six separate departments and more than a dozen independent agencies, observes a report released this week by the Senate Budget Committee. These programs often overlap and there is no effort to test how successful any of them are in accomplishing their objectives. The 160 programs were actually identified in a 2012 GAO report (and listed here by agency).

Click image to download this report.

In a Budget Committee hearing on September 16, University of Virginia economist Edgar Olsen testified that “most current recipients” of federal low-income housing assistance “are served by programs whose cost is enormously excessive for the housing provided.” He recommended phasing out the least-cost-effective ones while retaining the ones that were working the best. Continue reading

Low-Income Housing Tax Credits Database

Last week’s Antiplanner policy brief reviewed Seattle’s low-income housing program and found that it was mainly aimed at getting people to live in transit-oriented developments and did very little to help low-income families. The natural question to ask is whether this is a national problem or confined to Seattle and a few other cities. My hypothesis is that it is largely an issue in growth-management cities that are trying to get people to live in higher densities and replace cars with transit, cycling, and walking.

To help answer this question, I downloaded the Department of Housing & Urban Development’s LIHTC database, which lists 48,672 projects supported by tax credits since 1987 (click here to download the 18.9-MB data file or click the previous link to download a subset of the database). HUD seems to be behind as the database does not list any projects that were completed in 2019 or 2020.

Still, it includes a lot of information, including the address of each project, the number of units and how many are dedicated to low-income households, the tax credits allocated to each project, and whether other federal subsidies also went to the project (but not how much those subsidies were). Continue reading