Density Mandates Won’t Help

Proponents of a bill winding its way through the Colorado legislature assume that increased housing densities will make housing more affordable and will reduce greenhouse gas emissions. Neither of these assumptions are valid, according to an article in Complete Colorado. And you know it’s true, because I wrote it.

This chart compared population densities and housing affordability in the nation’s top 100 urban areas.

You may have seen diagrams like the above here before, but I made this one using the latest density data from the 2020 census combined with housing affordability data from the 2020 American Community Survey. Counting the top 50 urban areas, the correlation was 0.85 (where 1 is perfect and anything close to 0 is completely random); for the top 100, it was 0.79; for the top 200 it was still a respectable 0.70. Continue reading

Soaking the Rich Fails in Los Angeles

To help fund the $1.3 billion that Los Angeles’ city council believes it needs to house the homeless, the city decided to impose a “mansion tax” of 4 percent on the sales of any homes or commercial properties above $5 million and 5.5 percent on sales above $10 million. This was projected to bring in $900 million a year, funding most of the homeless program.

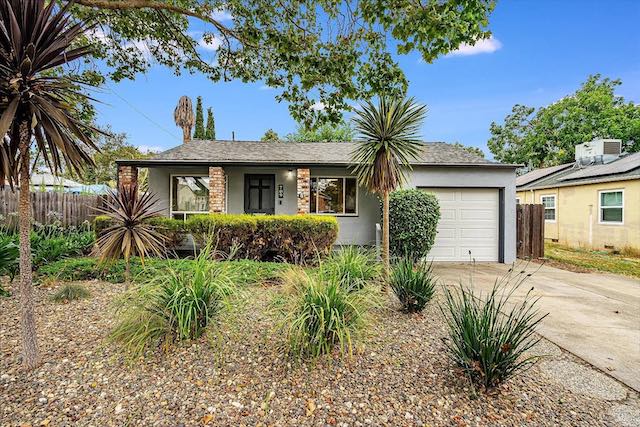
This home is currently on the market in Los Angeles for an asking price of $5.667 million. Many homes of this size are available for under $1 million in Houston and San Antonio and few are asking more than $2 million.

The reality is far different because planners, as usual, failed to take into account how their regulations and taxes would influence human behavior. In the month before the tax went into effect on April 1, 126 homes sold for more than $5 million. In the month since? Just two. Continue reading

When Is a Fee Not a Fee?

A month ago, I commented on Colorado Senate Bill 213, which would allow the state to give major cities housing targets that they would have to meet and require cities to rezone single-family neighborhoods to allow for more density. Some of the worst features of the bill have been deleted, but the bill is still bad.

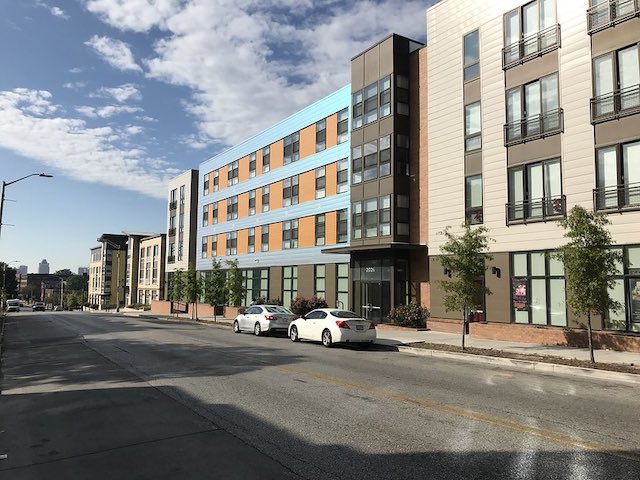
A 736-square-foot apartment in this Denver mid-rise development costs more to rent than the mortgage on many 2,000-square-foot single-family homes in cities that don’t have urban-growth boundaries, yet the state wants to force cities to allow (and subsidize) more of these as “affordable housing.”

The reason why the rezoning requirement was dropped from the bill was that the cities themselves opposed it — not because they opposed density but because they said they were already imposing density on their residents and didn’t need to be told to do so by the state. Many cities in the Denver metro area are landlocked, so the only way for them to meet state housing targets would be to densify anyway. Continue reading

Homelessness Down Since 2010, Up Since 2020

Nearly 600,000 Americans were homeless in 2022, according to a report recently released by the Department of Housing and Urban Development (HUD). The department has been attempting to count homeless numbers each year since 2007, and the latest numbers are based on counts made in January 2022.

Click image to download a 15.5-MB PDF of this 112-page report.

According to HUD’s counts, the total number of homeless people in the U.S. grew by nearly 2,000 between 2020 and 2022 — but that’s just 0.3 percent and easily within the margins of error of the counts. HUD also estimates the number declined by more than 54,600 between 2010 and 2022, which is large enough to be more likely. Continue reading

More Planning Means Less Housing

A new paper from the Urban Institute and the University of California, Berkeley, is further proof, if anyone needs it, that more planning means less housing. Unfortunately, the authors of this paper failed to get this, as the paper praises states that have the most supposedly pro-housing laws even though those are the very states that have least affordable housing.

Click image to download a 1.6-MB PDF of this 30-page report.

A map on page 6 of the report shows how many laws various states have passed that “incentivize housing.” California, Oregon, and Washington lead the way with more than 10 such laws each. In fact, appendix A reveals that California has passed 56 such laws, far more than any other state. Needless to say, California has the least-affordable housing in the nation. Continue reading

Housing Doesn’t Need Government Planning

“Housing needs planning” is the opening line of Colorado Senate Bill 23-213, which was introduced into the legislature last week. By “planning” the bill means government planning, and the proposed law would require the state to determine housing needs and set housing targets and to interfere with local zoning to require more accessory dwelling units, multifamily housing, and transit-oriented developments.

Apartments in Boulder, Colorado, the most heavily planned and most expensive housing market in the state.

The basic premise of this law is wrong: housing and government planning go together like oil and water. A look at housing markets in Colorado and nationwide show that states and regions with more planning end up having less affordable housing. A secondary premise, that multifamily housing is more affordable than single-family homes, is also wrong. Continue reading

The Latest International Affordability Data

“Housing affordability in 2022 continued to reflect the huge price increases that occurred during the pandemic demand shock,” reports demographer Wendell Cox in his 2023 international housing affordability report. “Some housing affordability improvements have since occurred and more are likely as the demand shock is hopefully replaced by more normal market trends.”

Click image to download a 3.6-MB PDF of this 26-page report.

Cox measures housing affordability in more than 90 urban areas located in Australia, Canada, Hong Kong, Ireland, New Zealand, Singapore, the United Kingdom, and the United States by dividing median home prices with median household incomes. I use the same measure except I use median family incomes, which are readily available through 2021 using U.S. census data. Cox probably uses household incomes because they are more readily available for 2022 and in other countries. This is the latest update of a series of reports going back to 2005 (with data for 2004). Continue reading

Enabling Homelessness

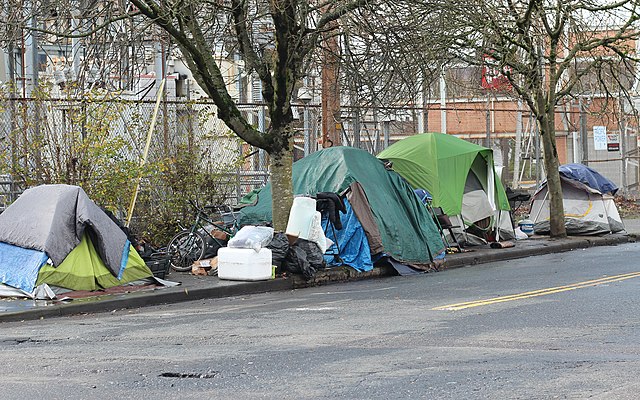
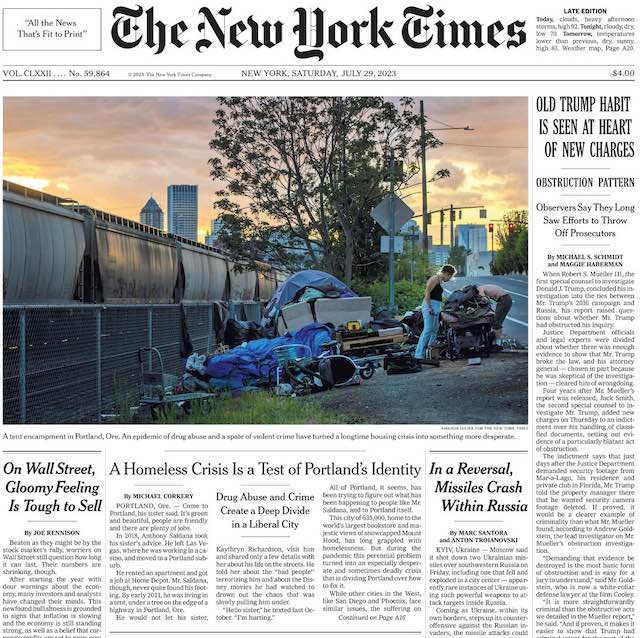
More than 5,000 people are homeless in Oregon’s Multnomah County, most of them in Portland, and Oregon has the fourth-highest rate of homelessness in the nation. According to community-service worker Kevin Dahlgren, the problem is that the bureaucracies and non-profit groups that work on the homeless issue spend their time enabling people to remain homeless, rather than trying to rehabilitate them so they can get a job and housing.

The homeless crisis is making parts of Portland unlivable, yet the social service groups “are part of the problem,” says Dahlgren. Instead of getting people permanently off the streets, Portland and other cities are now giving away tents, blankets, and other materials that allow homeless people to remain on the streets. What they should be doing, says Dahlgren, is “ending homelessness by empowering, not enabling” homeless people. Continue reading

Town and Country Dystopian Act

The United Kingdom has some of the least affordable housing of any country in the world, with median homes costing more than five times median incomes. In the United States, only California and Hawaii have less affordable housing. A new report estimates that the U.K. needs 4.3 million homes to restore affordability, but the country’s planning system prevents those homes from being built.

Click image to download a 5.1-MB PDF of this 65-page report.

The report, which is published by a think tank called Centre for Cities, correctly places the blame for the state of the country’s housing on the Town & Country Planning Act of 1947. This law took away development rights from every private landowner in the country and only allowed new development if it complied with local and regional land-use plans. Continue reading

Urbanization by State

The share of land in the United States that is urbanized grew from 2.90 percent in 2010 to 2.94 percent in 2020, according to data recently released by the Census Bureau showing how many square miles of land in each state was urbanized as of 2020. This can be compared with 2010 data and the total land area of each state to calculate what percentage had been urbanized in each of the two years.

Click image to download a 15.0-MB PDF of this map distinguishing urban from rural areas in 2020.

One reason why the growth was so small was that the Census Bureau redefined urban; under the old definition, any community of 2,500 people was urban; under the new definition, communities had to have 5,000 people or 2,000 residences. However, this only makes a small difference — perhaps 0.1 percent — because such communities are, by definition, small. Continue reading