A math-challenged report finds that homes in the San Francisco Bay Area are still selling above their asking price despite census data showing that the region’s population is declining. The report says that Vallejo (which is part of the San Francisco Bay Area but the Census Bureau counts as a separate urban area) “is the number one metro area for selling homes over the list price,” followed by San Francisco and Rochester, New York.
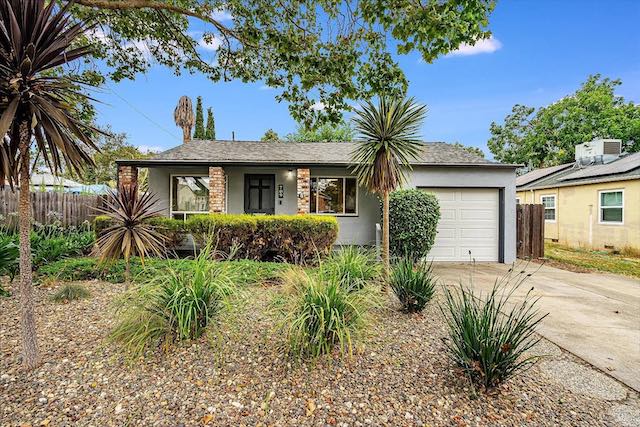
This 1,020-square-foot house on a 4,800-square-foot lot is offered for sale in Vallejo for $499,000, but if recent experience is any guide it will actually sell for around $536,000.
The report says that homes in Vallejo typically sell for 1.07 percent more than their asking price and homes in San Francisco sell for 1.03 percent more than their asking price. However, this is wrong: what the report means is that homes in Vallejo sell for 1.07 times their asking price (which is 7 percent more) and homes in San Francisco (meaning the San Francisco-Oakland urban area) sell for 1.03 times their asking price (or 3 percent more).
According to Census Bureau estimates, the population of Vallejo, San Francisco, and other major cities in the Bay Area (Berkeley, Fremont, Oakland, San Jose, San Mateo, San Rafael, etc.) all declined between 2020 and 2022. Yet people are still bidding up home prices.
A close look at Zillow’s home value index for single-family homes reveals that prices in the Vallejo metro area grew by 30 percent and San Francisco by 40 percent between late 2019 and mid 2022, but then fell by 5 percent in Vallejo and 10 percent in San Francisco after 2022. Condo prices also grew by 30 percent in Vallejo, but only 10 percent in San Francisco, between 2019 and 2022, then fell by about 5 percent.
A close look at the data shows that prices grew everywhere in the country between late 2019 and mid-2022 and, on average, grew by more than in San Francisco and Vallejo. Home prices in Atlanta, Austin, Charlotte, Phoenix, and Tampa, for example, all grew by more than 50 percent. Prices continued to grow in most places between mid-2022 and mid-2023, and even where they declined, it was generally by a smaller amount than in San Francisco and Vallejo.
The increase in prices between 2019 and 2022 was due to large numbers of people realizing they could work at home and, therefore, could live anywhere they wanted. The more recent decline in prices must be due to home builders solving some of the problems with supply chains and labor shortages and generally catching up with the increases in demand caused by many people realizing they can work at home.
Last week, the Antiplanner reported on the latest housing affordability data. It is worth noting that there is a bias in these data. While the Census Bureau estimates of home values is based on a cross-section of all homes in a region, the data used by Cox (which are from Harvard’s Joint Center for Housing Studies) are based on monthly home sales.
Normally, that might not make a big difference, but people who are moving because they have become remote workers tend to have higher than average incomes. Since median incomes include all people, this has pushed the apparent median-price-to-median-income ratios above the true median-value-to-median-income ratios. Thus, when Cox reports that median Houston prices grew to 4.7 times median Houston incomes in late 2022, that may not accurately reflect housing affordability.
One way to check this is by comparing Zillow’s metropolitan area home prices with the Census Bureau’s. The most recent Census Bureau value estimates are from 2021. Zillow’s average prices for that year tend to be about 20 percent to 30 percent more than the Census Bureau’s. I suspect this is due to the difference in incomes of people buying homes compared to the average incomes in those urban areas. This suggests that the value-to-income ratios reported by Cox should be reduced by about 20 percent.
Another way to check this is by looking at rents, which are probably less influenced by the higher incomes of remote workers. While Zillow home prices in Houston grew by 39 percent between late 2019 and mid 2022, rents grew by only 17 percent. In the same time period, rents grew by only 7 percent in San Francisco, but 26 percent nationwide (compared with 44 percent for home prices).
These numbers also suggest a 20 percent reduction of value-to-income ratios is appropriate. That would reduce Houston’s to about 3.8 and San Francisco’s to about 8.6.
Getting back to the original study comparing final sale prices with offer prices, it shouldn’t be a big surprise that San Francisco homes are selling for 3 percent more than the listed prices. The sale-to-list ratios were much higher before the pandemic, while the ratio actually fell to less than 100 percent early this year. The real question is how fast prices are growing, and they are growing faster in many other parts of the country than they are in the Bay Area.


Wait… what? What is going on in ( dieing ) Rochester, NY? Weird.