Transit’s recovery falters as ridership in August was just 49.97 percent of August, 2019 numbers, according to data released yesterday by the Federal Transit Administration. This is only slightly above July’s 49.13 percent of July 2019.
I’ll post Amtrak and driving data when they become available.
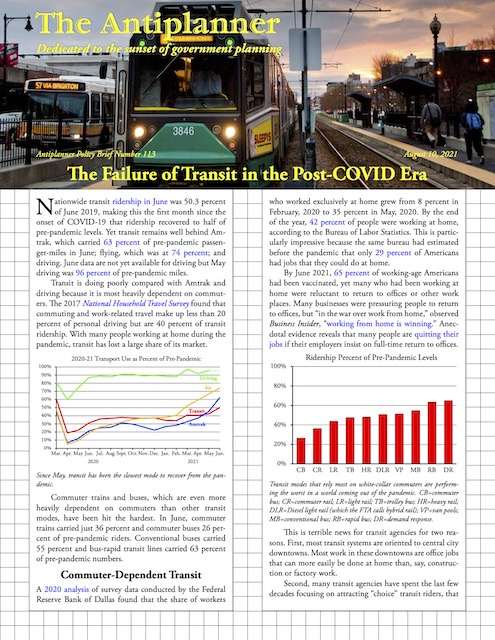
August data are not yet available for Amtrak or driving, but both were well above transit levels in July. August flying fell slightly from July, probably because of worries about a new wave of COVID and associated health mandates. These factors may have also depressed transit ridership for the month. Continue reading