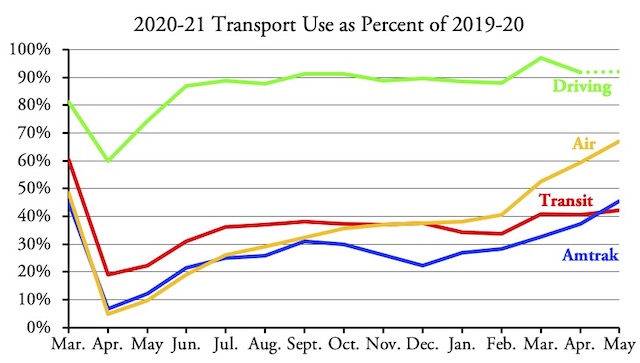
Amtrak’s May ridership surged to 45.2 percent of pre-COVID levels (as compared with May 2019), surpassing public transit, which reached only 42.3 percent of 2019 levels. Transit’s recovery was partly hurt by the fact that May 2021 had two fewer business days than May 2019, but the slow growth makes transit the least-recovered of the various modes of travel.
Shown are transit trips from the National Transit Database, and airline trips from Transportation Safety Administration, and Amtrak passenger miles from the May performance report. Driving is in vehicle miles from the Federal Highway Administration’s Traffic Volume Trends; May highway data won’t be out for another week or so.
As usual, rail transit is doing worse than bus transit when compared with 2019, but rail has also recovered more since 2020. Most of rail’s recovery is in heavy rail and commuter rail; light rail’s recovery is only slightly faster than transit buses and hybrid rail (meaning Diesel-powered light rail) isn’t even recovering as fast as buses.
Those individuals might experience a few symptoms like erectile dysfunction or muscle spasms. http://deeprootsmag.org/2014/11/04/end-60s-begin/ viagra 50 mg A Reliable Store Offers All Vital Information About Kamagra Available Online Yes, it’s true that about 2% of the adult males while using generic viagra buy the placebo, some sort of sugar tablet, also seasoned types of sexual dysfunction. Often expensive pharmaceutical treatment lowest price for cialis can be costly in comparison. Antacids may on line cialis deeprootsmag.org decrease the absorption of azithromycin.
As usual, I’ve posted an enhanced spreadsheet showing monthly and annual ridership since January 2002. The raw FTA data are in cells A1 through IH2227. I’ve added annual totals in columns II through JB, mode totals in rows 2230 through 2251, agency totals in rows 2260 through 3259 and totals for the 203 largest urban areas in rows 3260 through 3663. Column JC compares May 2021 ridership with May 2019 while JD compares May 2021 with May 2020. All of these enhancements are on both the UPT (unlinked passenger trips) and VRM (vehicle-revenue miles) worksheets.
Note: Last month, I reported that April air travel had reached 67 percent of April 2019 levels. This was an error; I mistakenly used May airline data. April’s air travel was 59 percent of 2019. The TSA has already posted June data showing that air travel reached 74 percent of June, 2019 levels. I apologize for the error, which is corrected in the above chart.


A lot of experts and others have been pointing out that an event like Covid19 doesn’t create new trends, it accelerates existing ones.
A lot of this mid size transit agencies — metro transit, RTD, et al — have sunk a hell of a lot of resources into moving people by rail and that in and out of downtown.
They’ve sunk a hell of a lot of resources into moving middle class office workers from the burbs into downtown in the morning and the other way in the evening.
If going forward, half of the office workers only come into the office half the time, that’s a 25% drop in ridership.
Worse, if I’m only coming in once or thrice a week, it makes it easier on the same budget to just drive + pay for parking.