Regional Transportation Planning After COVID

The Federal Aid Highway Act of 1962 required urban areas of 50,000 or more people to have “a continuing, comprehensive transportation planning process carried out cooperatively by states and local communities.” The Federal Aid Highway Act of 1973 specified that this planning should be done by metropolitan planning organizations (MPOs) overseen by elected officials (such as city councilors or county commissioners) representing a majority of people in the urban area. These MPOs are often called “councils of governments” or “associations of governments.”
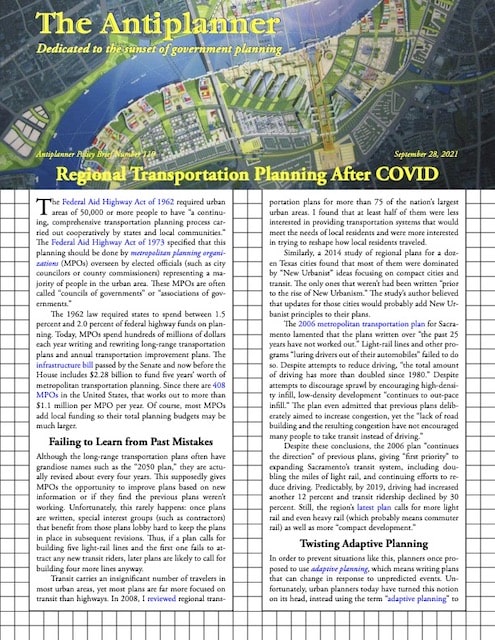
Click image to download a four-page PDF of this policy brief.

The 1962 law required states to spend between 1.5 percent and 2.0 percent of federal highway funds on planning. Today, MPOs spend hundreds of millions of dollars each year writing and rewriting long-range transportation plans and annual transportation improvement plans. The infrastructure bill passed by the Senate and now before the House includes $2.28 billion to fund five years’ worth of metropolitan transportation planning. Since there are 408 MPOs in the United States, that works out to more than $1.1 million per MPO per year. Of course, most MPOs add local funding so their total planning budgets may be much larger. Continue reading

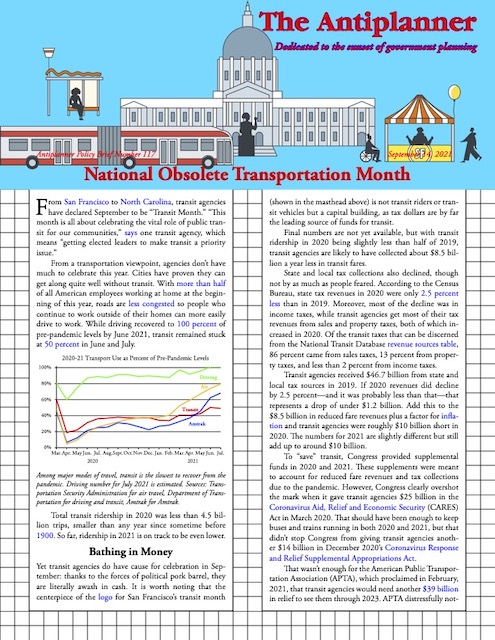
National Obsolete Transportation Month

From San Francisco to North Carolina, transit agencies have declared September to be “Transit Month.” “This month is all about celebrating the vital role of public transit for our communities,” says one transit agency, which means “getting elected leaders to make transit a priority issue.”

Click image to download a PDF of this four-page policy brief.

From a transportation viewpoint, agencies don’t have much to celebrate this year. Cities have proven they can get along quite well without transit. With more than half of all American employees working at home at the beginning of this year, roads are less congested so people who continue to work outside of their homes can more easily drive to work. While driving recovered to 100 percent of pre-pandemic levels by June 2021, transit remained stuck at 50 percent in June and July. Continue reading

Charting Transit Values and Trends

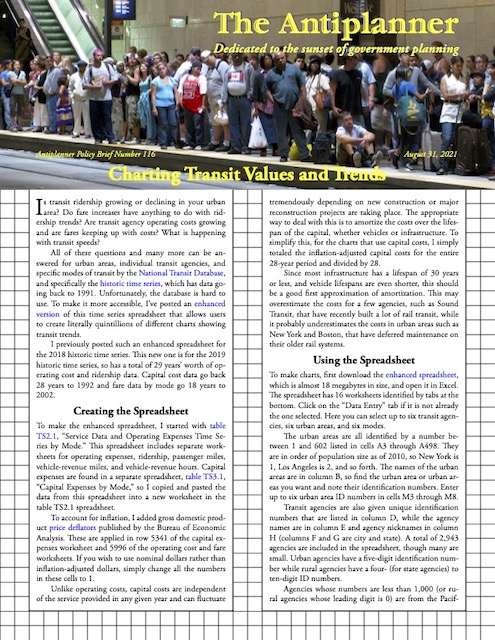
Is transit ridership growing or declining in your urban area? Do fare increases have anything to do with ridership trends? Are operating costs growing and are fares keeping up with costs? What is happening with transit speeds?

Click image to download a four-page PDF of this policy brief.

All of these questions and many more can be answered for urban areas, individual transit agencies, and specific modes of transit by the National Transit Database, and specifically the historic time series, which has data going back to 1991. Unfortunately, the database is hard to use. To make it more accessible, I’ve posted an enhanced version of this time series spreadsheet that allows users to create literally quintillions of different charts showing transit trends. Continue reading

Moving the Overton Window

Twenty years ago, South Carolina had two citizens’ groups advocating for property rights. One of the groups was highly successful, having persuaded the state legislature to pass several important laws protecting property rights. The other group had the same aims but was completely unsuccessful, and could rarely get a meeting with important legislators, much less persuade them to pass a law.

Click image to download a four-page PDF of this policy brief.

The difference was that the unsuccessful group repeatedly claimed that Agenda 21 was a threat to property rights. This totally undermined their credibility. Few members of the state legislature had ever met a United Nation’s official, and certainly didn’t see any connection between state or local policies and an accord written in Rio de Janeiro in 1992. Continue reading

The World’s Finest Railroads

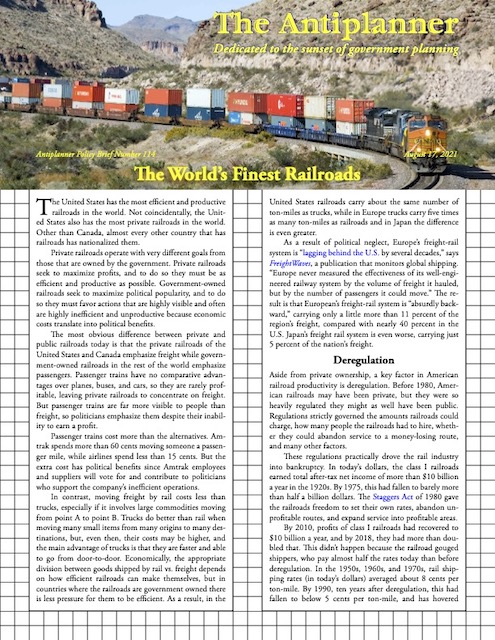
The United States has the most efficient and productive railroads in the world. Not coincidentally, the United States also has the most private railroads in the world. Other than Canada, almost every other country that has railroads has nationalized them.

Click image to download a four-page PDF of this policy brief.

Private railroads operate with very different goals from those that are owned by the government. Private railroads seek to maximize profits, and to do so they must be as efficient and productive as possible. Government-owned railroads seek to maximize political popularity, and to do so they must favor actions that are highly visible and often are highly inefficient and unproductive because economic costs translate into political benefits. Continue reading

The Failure of Transit in the Post-COVID Era

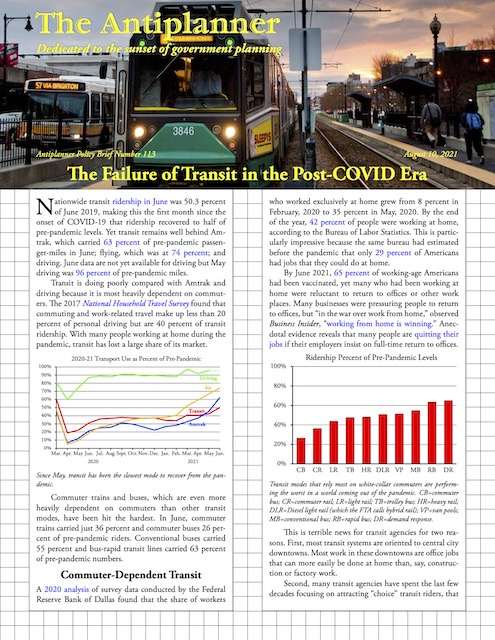
Nationwide transit ridership in June was 50.3 percent of June 2019, making this the first month since the onset of COVID-19 that ridership recovered to half of pre-pandemic levels. Yet transit remains well behind Amtrak, which carried 63 percent of pre-pandemic passenger-miles in June; flying, which was at 74 percent; and driving. June data are not yet available for driving but May driving was 96 percent of pre-pandemic miles.

Click image to download a four-page PDF of this policy brief.

Transit is doing poorly compared with Amtrak and driving because it is most heavily dependent on commuters. The 2017 National Household Travel Survey found that commuting and work-related travel make up less than 20 percent of personal driving but are 40 percent of transit ridership. With many people working at home during the pandemic, transit has lost a large share of its market. Continue reading

Moving from Transit Apartheid to Transportation Equity

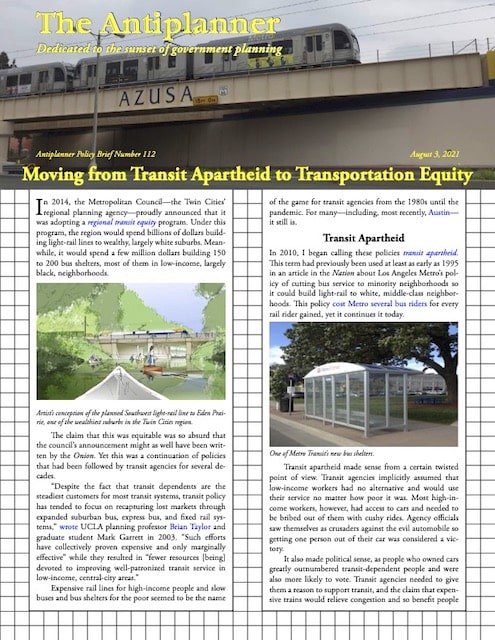
In 2014, the Metropolitan Council—the Twin Cities’ regional planning agency—proudly announced that it was adopting a regional transit equity program. Under this program, the region would spend billions of dollars building light-rail lines to wealthy, largely white suburbs. Meanwhile, it would spend a few million dollars building 150 to 200 bus shelters, most of them in low-income, largely black, neighborhoods.

Click image to download a three-page PDF of this policy brief.

The claim that this was equitable was so absurd that the council’s announcement might as well have been written by the Onion. Yet this was a continuation of policies that had been followed by transit agencies for several decades. Continue reading

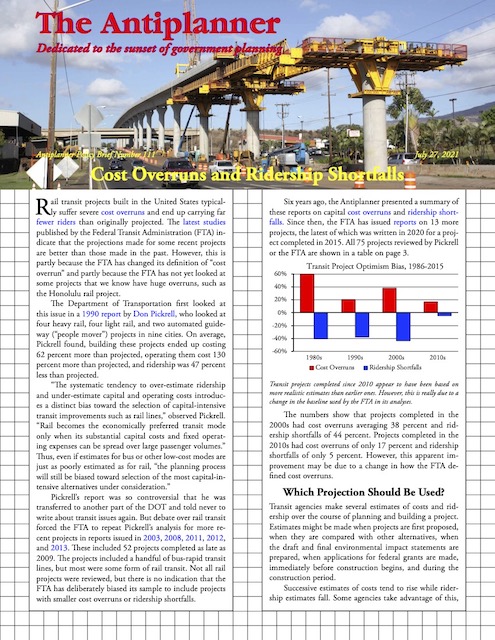
Cost Overruns and Ridership Shortfalls

Rail transit projects built in the United States typically suffer severe cost overruns and end up carrying far fewer riders than originally projected. The latest studies published by the Federal Transit Administration (FTA) indicate that the projections made for some recent projects are better than those made in the past. However, this is partly because the FTA has changed its definition of “cost overrun” and partly because the FTA has not yet looked at some projects that we know have huge overruns, such as the Honolulu rail project.

Click image to download a five-page PDF of this policy brief.

The Department of Transportation first looked at this issue in a 1990 report by Don Pickrell, who looked at four heavy rail, four light rail, and two automated guideway (“people mover”) projects in nine cities. On average, Pickrell found, building these projects ended up costing 62 percent more than projected, operating them cost 130 percent more than projected, and ridership was 47 percent less than projected. Continue reading

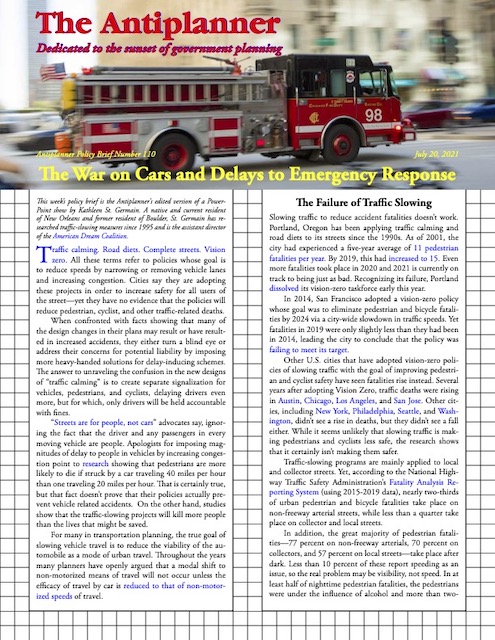
The War on Cars and Delays to Emergency Response

By Kathleen St. Germain

Traffic calming. Road diets. Complete streets. Vision zero. All these terms refer to policies whose goal is to reduce automobile speeds by narrowing or removing vehicle lanes and increasing congestion. Cities say they are adopting these programs to increase safety for all users of the street, yet they have no evidence that the policies will actually reduce pedestrian, cyclist, and other traffic-related deaths.

Click image to download a four-page PDF of this policy brief.

When confronted with facts showing that many of the design changes in their plans may result or have resulted in increased accidents, they either turn a blind eye or address their concerns for potential liability by imposing more heavy-handed solutions for delay-inducing schemes. The answer to unraveling the confusion in the new designs of “traffic calming” is to create separate signalization for vehicles, pedestrians, and cyclists, delaying drivers even more, but for which, only drivers will be held accountable with fines. Continue reading

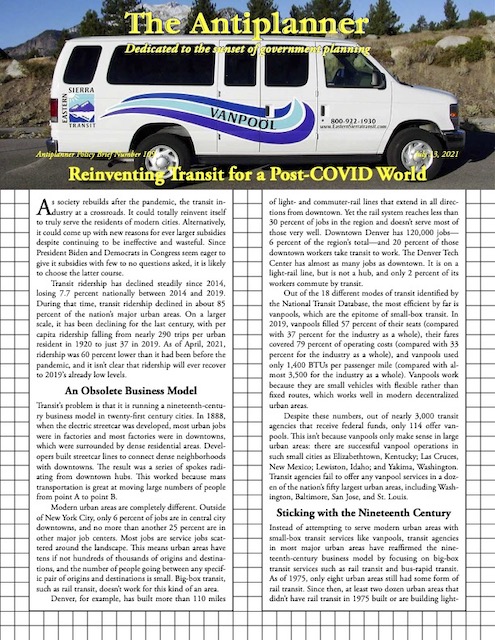
Reinventing Transit for a Post-COVID World

As society rebuilds after the pandemic, the transit industry at a crossroads. It could totally reinvent itself to truly serve the residents of modern cities. Alternatively, it could come up with new reasons for ever larger subsidies despite continuing to be ineffective and wasteful. Since President Biden and Democrats in Congress seem eager to give it subsidies with few to no questions asked, it is likely to choose the latter course.

Click image to download a five-page PDF of this policy brief.

Transit ridership has declined steadily since 2014, losing 7.7 percent nationally between 2014 and 2019. During that time, transit ridership declined in about 85 percent of the nation’s major urban areas. On a larger scale, it has been declining for the last century, with per capita ridership falling from nearly 290 trips per urban resident in 1920 to just 37 in 2019. As of April, 2021, ridership was 60 percent lower than it had been before the pandemic, and it isn’t clear that ridership will ever recover to 2019’s already low levels. Continue reading