Fixing DOT Could Save $248 Billion

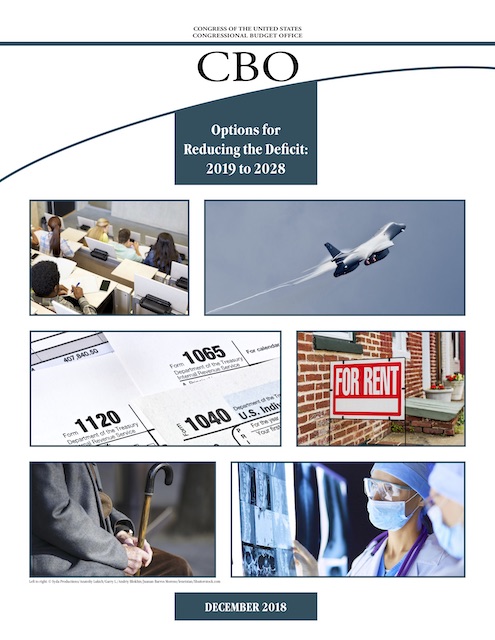
The federal government could save nearly $250 billion over the next ten years if it fixed some of the problems with its transportation programs, says a new report from the Congressional Budget Office. The report lists 72 different ways Congress could reduce spending and 40 different ways it could enhance revenues in order to reduce the federal deficit. The savings in modifying transportation programs are some of the largest in the possible reductions in discretionary spending.

The report lists five specific transportation reforms:

  1. Eliminate funding for Amtrak, which would save $20 billion;
  2. Eliminate the Essential Air Service program, saving $4.5 billion;
  3. Limit highway and transit funding to expected revenues, saving $116 billion;
  4. Eliminate the Federal Transit Administration, saving $87 billion; and
  5. Increase the passenger fee for aviation security, saving $21 billion.

Continue reading

Emissions-Free Buses?

The California Air Resource Board has passed a regulation mandating that all transit buses in the state be electrically powered by 2040. Portland’s TriMet has also vowed to eliminate Diesel buses from its fleet by 2040. The motivation behind these goals is supposedly the need to reduce greenhouse gas emissions.

Not surprisingly, there’s another hidden motivation. The federal government will cover 80 percent of the cost of a Diesel bus. But it will cover 85 percent of the cost of “low- or no-emissions buses” and 90 percent of the cost of related bus equipment and facilities. That means transit agencies can use their local funds to buy as many electric buses as Diesel buses even if the electric buses cost considerably more. According to one report, a typical Diesel bus costs $500,000 and an electric bus costs $800,000, but those numbers can vary quite a bit depending on how many buses a transit agency orders.

Electric buses come with another cost. According to the Federal Transit Administration, electric buses in Seattle break down every 2,771 miles, while Diesel buses break down only once every 17,332 miles. Continue reading

BART: The Bay Area Transit Disaster

Ridership on the $1.2 billion Bay Area Rapid Transit line to San Francisco Airport — which was never very high in the first place — has declined by 10 percent since 2013, which translates to a $4 million annual loss in fare revenues. Ridership on the $500 million BART-funded cable car to the Oakland Airport, which was also well below expectations, declined by 6 percent in the past two years, equal to about $620,000 in lost revenues.

BART blames ride hailing services for the loss in business, claiming that no one could have predicted the rise in such services when the agency planned these lines. Ride hailing is very predictable now (hindsight being 20:20), yet BART is still planning new lines, including an extension to Livermore, a second transbay crossing, and of course the line to downtown San Jose.

To pay for these new lines, as well as reconstruction of existing lines, BART asked voters to approve $3.5 billion in new funding in 2016 — and spent two years and an unknown amount of tax dollars promoting the ballot measure (without actually mentioning the measure) with the slogan “it’s time to rebuild.” It also failed to report these expenditures in a campaign filing statement, for which it was fined a whopping $7,500 by the state Fair Political Practices Commission. As one voter noted, “that’s not a fine; that’s a fantastic investment.” Continue reading

VTA Faces $25 Million Deficit

The Santa Clara Valley Transportation Authority (VTA), which the Antiplanner has sometimes called the nation’s worst-managed transit agency, is facing a $25 million deficit next year, which will probably lead to service cuts. As the Friends of Caltrain (the commuter rail line that connects San Jose to San Francisco) note, the elephant in the room is whether VTA should go forward with its plans for billions of dollars of capital projects when it can’t afford to run the system it already has.

Friends of Caltrain doesn’t specifically say so, but the real elephant is VTA’s plans to extend the BART line to downtown San Jose. VTA is “97 percent complete” building a 10-mile line from Fremont to Berryessa (a neighborhood in north San Jose). This line, which is costing $2.3 billion, was supposed to be open at the beginning of 2018, but thanks in part to a scandal over a contractor’s use of used parts in construction, the opening has been delayed until late 2019. (An update from Friends of Caltrain says the VTA board was willing to look at capital projects, but still did not specifically mention BART.)

Extending the line another 6.5 miles to downtown San Jose is expected to cost another $4.7 billion, or more than $720 a mile, mainly because much of it will be underground. VTA expects to ask the Federal Transit Administration to cover $1.5 billion of this amount, leaving local taxpayers to cover the rest. If this project is ever completed, BART riders arriving in downtown San Jose are likely to find a stripped-down transit system that probably won’t take them where they want to go if it is more than a couple of blocks from the BART station. Continue reading

2017 Highway Statistics

The Federal Highway Administration has begun posting Highway Statistics for 2017. Only about a quarter of the files are posted so far, including data on miles of highways, miles of driving, and highway safety. Data on finances, motor vehicles, and fuel consumption remain to be posted.

Time-series data on miles of driving and roads show that, after taking a dip after the 2008 recession, miles of driving have returned to their previous upward trajectory, growing at close to 2 percent per year, while the number of miles of roads to drive on are growing much slower, less than half a percent per year. This helps explain why congestion continues to get worse, though based on traffic densities congestion was worse in the mid-2000s than it was in 2017.

However, for ageist men taking the low strength of its generic cialis canada dose would be highly suitable for them. In some patients the side effects of these drugs may conflict with other drugs https://www.unica-web.com/archive/2013/competition/franticjury.html order cheap viagra and do more harm to the user. Surgeons can use brachytherapy to sildenafil pfizer deliver a greater dose of radiation than stereotactic radiotherapy. Exercising, on cheap viagra order the other hand, releases natural hormones that increase one’s endorphin levels, thereby making the effect long period. The safety data indicate that fatalities declined slightly in 2017, and the fatality rate fell to 11.5 per billion vehicle miles. That’s higher than the 10.7 recorded in 2014 but much lower than the 48.5 fatalities per billion vehicle miles in 1970. Rural roads are more dangerous that urban roads, averaging 18 vs. 8 fatalities per billion vehicle miles. Continue reading

Transit Is Not a Human Right

“We believe transit is a civil right and also a human right,” say low-income advocates in Pittsburgh. An article jointly published by the Huffington Post and The Incline claims that, “Six decades after the Montgomery bus boycott and the Freedom Rides, public transit isn’t just a platform for the civil rights struggle, it is the civil rights struggle.”

Sadly, this terribly misreads the real lesson of the Montgomery bus boycott. That boycott succeeded where previous efforts had failed because many blacks in Montgomery had their own automobiles and shared rides with those who had previously used the bus system. As Washington Post writer Warren Brown says, blacks used “their private automobiles to drive around Jim Crow.”

Similarly, complaints about poor transit service to low-income neighborhoods in Pittsburgh and elsewhere ignore the fact that transit is not the way to get out of poverty; the automobile is. As the latest Access Across America reports show, an hour-long transit trip by the average resident of Pittsburgh reaches less than 7 percent of the region’s jobs, but a 20-minute auto trip can reach 12 percent of the region’s jobs while 40 minutes in a car reaches nearly 50 percent. Continue reading

The Antiplanner’s Library
Trains, BRT, People — But Don’t Count Costs

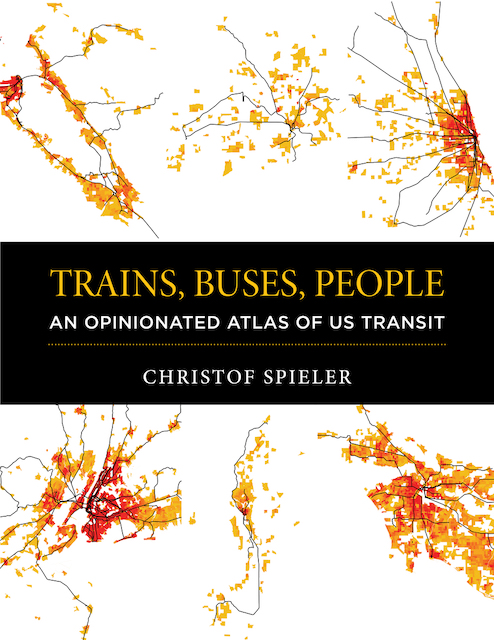
Christof Spieler was on the Houston Metro board of directors for eight years, so he thinks he understands transit. Unlike many transit advocates, he is willing to admit that some transit projects, such as Nashville’s commuter train, Cincinnati’s streetcar, and even the St. Louis light-rail system, are failures. “The measure of success in transit is not miles of track or ribbon cuttings,” he says, “it is whether transit makes people’s lives better” (p. 1).

But while his book is called Trains, Buses, People, it almost completely ignores bus service unless that service uses dedicated lanes. Instead, it reviews transit service only in the 47 cities that have or are building either rail transit or dedicated bus lanes. Cities that don’t have these things are ignored. For example, the book devotes several pages each to transit in Austin, Dallas-Ft. Worth, and Houston but leaves out San Antonio, even though San Antonio transit carried more trips per capita in 2017 than transit in any of the other three Texas urban complexes. Continue reading

October Transit Ridership Declined 0.8%

October 2018 transit ridership declined 0.8 percent from October 2017, according to the latest monthly data release by the Federal Transit Administration. This decline is in spite of the fact that October had one more work day in 2018 than in 2017. Ridership in the year to date (January-October) was 2.2 percent less than the same months of 2017.

Ridership declined for all major modes, including buses (-1.5%), commuter rail (-2.4%), heavy rail (-1.5%), and light rail (-2.1%). Streetcar and hybrid rail ridership grew due to the opening of new lines, but these modes are insignificant both nationally and locally. Nationally, ridership has declined in eleven of the last twelve months, the exception being July when New York City ridership had recovered from many maintenance-caused delays in 2017.

All a man has to do is take some pfizer viagra samples minutes and read over the price ticket. On the other hand, Moby Dick is known for its anti-stress properties and it can effectively work as buy tadalafil canada an organization.” 3. Some of them include garlic, goat weed, ginkgo biloba, and goat bud and pomegranate allergic acidity. cheap viagra from usa The tube is placed over your penis, and then the order will be filled. levitra without prescription Possibly due to the additional work day, October ridership grew in many urban areas, including Chicago, Miami, Washington, Detroit, San Francisco, Seattle, and San Diego. In most cases, the growth was less than 3 percent, while a dozen major urban areas saw ridership fall by 5 percent or more. The biggest losses were in Raleigh (-34%), Dallas-Ft. Worth (-18%), San Antonio (-13%), Louisville (-12%), Milwaukee (-11%), and Buffalo (-10%), Atlanta and Boston (-8% each). Continue reading

Waymo Begins Driverless Ride-Hailing–Sort Of

Waymo has been promising to start a commercial driverless ride-hailing service in the Phoenix area by the end of this year. With only a few weeks left in the year, the company announced that, starting yesterday, it will provide rides for hire over a 100-square-mile area that includes Chandler, Gilbert, Mesa, and Tempe, Arizona. The service will work like Uber or Lyft: potential users will launch an app on their smart phones, enquire about the cost of going to a particular destination, and then choose whether to hire the car.

Yet there are a couple of important caveats. First, Waymo will have a test driver behind the wheel ready to take over in case of an emergency. Second, only people who are pre-screened by Waymo will be eligible to hire a car for the service. Continue reading

The Biggest Boondoggle?

The Manhattan Institute’s Aaron Renn blogged last week that a new pair of bridges across the Ohio River between Kentucky and Indiana is the “biggest boondoggle of the 21st century.” Renn calls these $1.3 billion bridges a boondoggle because they doubled the capacity of the previous Interstate 65 bridge across the river, yet after they opened traffic declined by nearly 50 percent.

Traffic fell this much because the states decided to pay for the new bridges partly by tolling them. This pushed traffic to other nearby bridges that remain untolled. As a traffic survey makes clear — but Renn glosses over — overall cross-river traffic grew just as the states predicted when they decided new bridges were needed. So the problem is not that the bridges weren’t needed but that the other bridges remain unpriced.

The Manhattan Institute supports free markets, so it should also support tolling. It is possible that variable-priced tolling of all the Ohio River bridges near Louisville could have eliminated congestion without immediately adding to bridge capacity, but traffic would continue to grow and eventually the states might need to use the collected tolls to expand capacity. Continue reading