June Driving 0.75% Greater Than in 2019

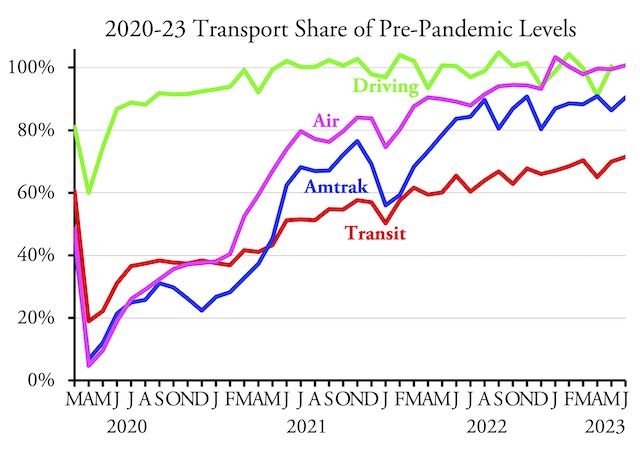
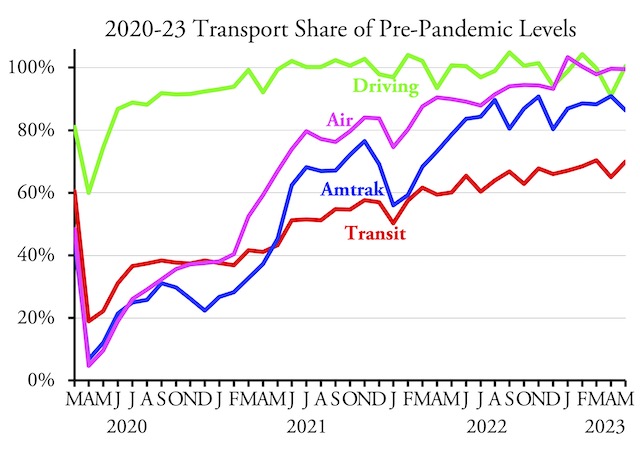
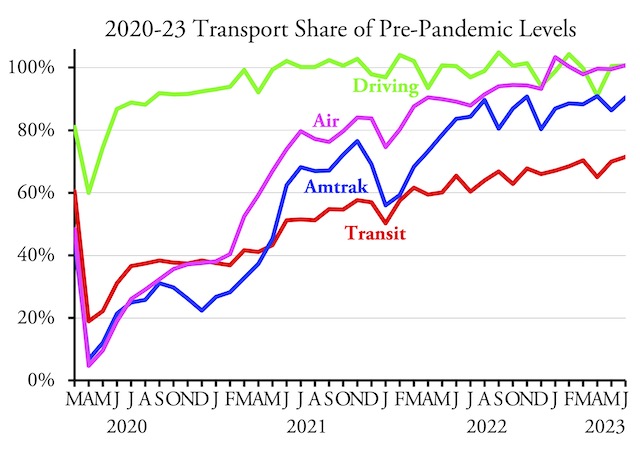
Americans drove slightly more miles in June 2023 than they did in June 2019, according to data released yesterday by the Federal Highway Administration. Highway driving first reached 100 percent of pre-pandemic levels in June of 2021 and has been hovering around 100 percent ever since. In comparison, flying didn’t reach 100 percent until January of this year, while Amtrak has been hovering around 90 percent since August 2022 and transit has never exceeded 72 percent.

For a detailed discussion of Amtrak results, see last Tuesday’s post. For a detailed discussion of transit and airline results, see last Saturday’s post.

Urban driving was only 99.0 percent of pre-pandemic levels, but rural driving more than made up for it at 105.3 percent. Total miles of driving exceeded 2019 numbers in 27 states, with the biggest gains in Idaho (117%), Missouri (114%), Alaska (114%), Colorado (113%), Wyoming (112%), and Michigan (111%). Driving is still only 76 percent of pre-COVID levels in the District of Columbia and is also woefully short in Illinois (84%), Massachusetts (91%), Maryland (92%), California (93%), Hawaii (94%), Washington (94%), and Georgia (94%). Driving in all other states was at least 95 percent of 2019 miles. Continue reading

New Jersey Challenges New York’s Cordon Fee Plan

With federal approval of New York’s environmental assessment, most of the federal, state, and local obstacles to New York City’s cordon pricing plan — which almost everyone erroneously calls a congestion pricing plan — have been removed. But there is still one more: New Jersey is suing to stop the plan because New Jersey residents would pay a large share of the costs yet get few of the benefits. As several New Jersey legislators have accurately pointed out, the plan “is nothing more than a cash grab” aimed at helping to close the deficit of the New York Metropolitan Transportation Authority (MTA) and specifically the subway system, which New Jersey drivers would rarely use.

Save money by staying out of the orange zone.

The plan calls for charging anyone who drives into Manhattan south of 60th street between 6 am and 10 pm to pay $23. This is expected to earn $1 billion a year, all of which would go to the MTA to help cover its $2.5 billion annual deficit. Low-income people would be able to use the amount they pay as a tax credit, but if they are low income they probably aren’t paying much in taxes. New Jersey residents would pay the $23 instead of, not on top of, existing tolls, which effectively increases their cost of entry into Manhattan by 56 percent. Taxi and other for-hire drivers would pay the fee just once a day even if they recross the cordon several times. Continue reading

Amtrak Carried 90.5% of 2019 PM in June

Amtrak carried 90.5 percent as many passenger-miles in June 2023 as the same month in 2019, according to the company’s monthly performance report released yesterday. This is only the third time Amtrak exceeded 90 percent of pre-COVID levels; the first time, in November 2022, it carried 90.8 percent and the second time, in April 2023, it carried 90.9 percent.

Data for driving is not yet available but an update will be posted here when it is. See Saturday’s post for a discussion of transit and air travel.

When measured by number of riders, the Northeast Corridor performed best, carrying 93.6 percent of 2019 numbers. Long-distance trains carried 85.5 percent while state-supported day trains carried just 81.4 percent. Amtrak didn’t reveal passenger-miles by train in 2019 so a comparison using that measure by route or train type isn’t possible. Continue reading

Chicago-St. Louis Rail Failure

Nearly two months ago, the Antiplanner reported that, after spending $2 billion, the Chicago-St. Louis high-speed rail would be speeded up from an average speed of 55.7 miles per hour (for the fastest train in the corridor) to 59.6 miles per hour. These higher average speeds were to go into effect on June 26 and would supposedly reduce travel times between Chicago and St. Louis by half an hour from what they had been before spending the money.

I am reminded of this by an article in the paper edition of Trains magazine, which reported that trains were indeed speeded up on June 26. However it turns out the gains are even worse than I reported. Yes, one of the five trains in the corridor will go an average of 59.6 miles per hour (but the others will go slower). But the $2 billion spent in the corridor didn’t come close to fulfilling the promises made when the federal government handed out the funds in 2010. Continue reading

June Transit Carried 71% of Pre-COVID Riders

America’s transit agencies carried 71.4 percent as many riders in June 2023 as they did in the same month of 2019, according to data released by the Federal Transit Administration yesterday. This is the highest percentage of 2019 ridership since February, 2020. One reason for the gain above previous months is that June had two more business days in 2023 than it did in 2019.

Data are not yet available for highway or Amtrak travel. However, boarding numbers from the Transportation Security Administration indicate that the airlines carried 100.8 percent as many riders in June of 2023 as June of 2019. I’ll post updates for driving and Amtrak when those data are released. Continue reading

Amtrak Carried 86% of Pre-Pandemic PM in May

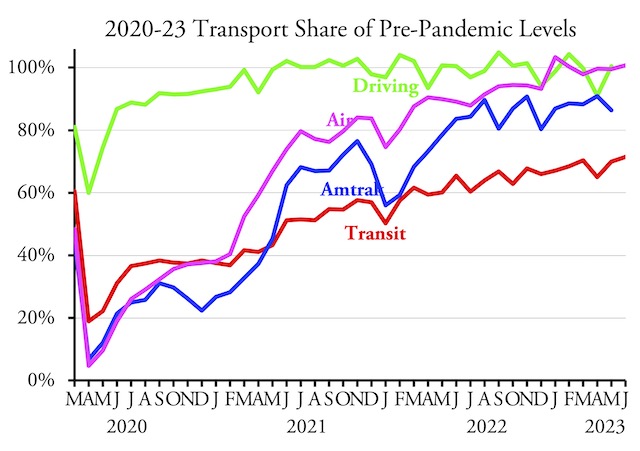
Amtrak carried 492 million passenger-miles in May 2023, which was just 86.4 percent of the 569 million passenger-miles it carried in the same month of 2019, according to Amtrak’s latest monthly performance report. Considering that Amtrak’s April passenger-miles were nearly 91 percent as many in 2023 as 2019, this is a disappointing result. Since Amtrak ridership usually usually picks up in May due to increased vacationers, this suggests that Americans aren’t enthusiastic about riding trains for discretionary travel in a post-COVID world.

For detailed comments on transit and highways, see my July 12 post.

All three types of Amtrak trains underperformed in May, with Northeast Corridor trains carrying less than 88 percent of pre-pandemic riders, long-distance trains carrying 85 percent, and state-supported day trains carrying less than 81 percent. It is worth noting that Amtrak is putting most of the money it received for expansion in the infrastructure bill into state-supported trains even though they are the worst-performing part of its network. Amtrak’s reasoning is that Congress gave it money for capital improvements but not operating costs, so it will need to persuade the states to pay for operating costs of any new routes or increased frequencies. Continue reading

Fixing the Failed the Music City Star

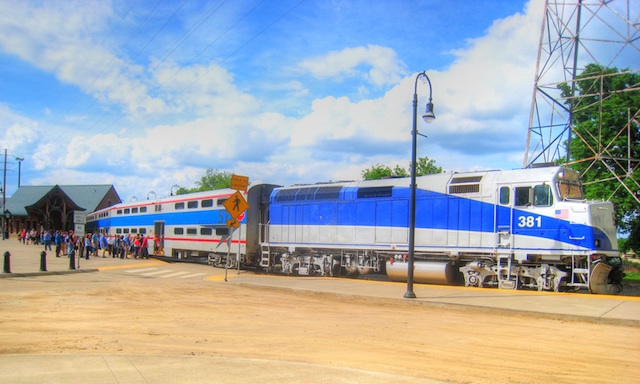
The Regional Transportation Authority of Nashville is asking members of the public how the agency can make its commuter train more convenient to riders. The train, once called the Music City Star but since renamed the much less evocative WeGo Star, was supposed to carry 700 round trips a day in its first year but the closest it came was in 2018 when it carried 581 round trips a day.

In 2021, this fell to a mere 69 round trips a day. The transit agency, which also calls itself WeGo, spent $4 million operating the line but earned less than $142,000 in revenues, which works out to an operating subsidy of more than $108 per rider. The agency claims ridership is currently up to 200 round-trips a day, but even if that’s true it still represents subsidies of around $35 per rider. Continue reading

Is Telecommuting More Productive?

A few weeks ago, the Economist gravely announced that people working at home were less productive than people who commuted to a workplace. I didn’t find its evidence persuasive, however, as the studies it cited mostly dealt with low-skilled jobs such as call centers and data entry.

Click image to download a 17.4-MB PDF of this report from the McKinsey Institute.

Yesterday, the Hill reported just the opposite: telecommuting, a new study has shown, increases worker output. This is partly because remote workers save a lot of time by not having to commute, and they tend to spend almost half of that time working. The article also pointed out that overall worker productivity is higher now than before the pandemic, and telecommuting is one of the factors increasing that productivity. Continue reading

Houston BRT Failure

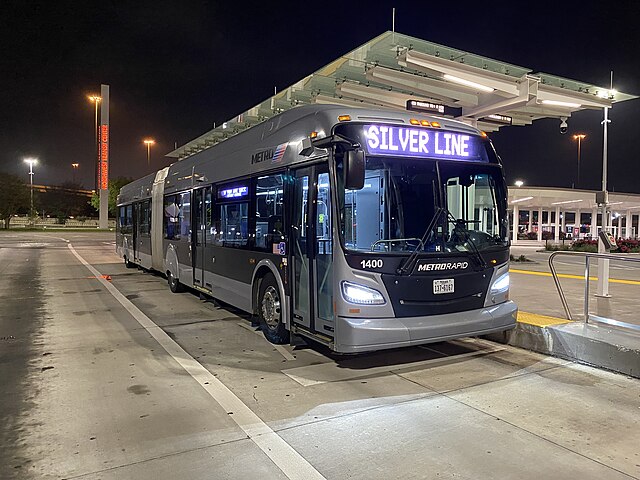
A Houston bus rapid transit route over dedicated bus lanes is attracting less than 10 percent of the riders that were projected for it. The Silver Line opened in August 2020 with the expectation that it would carry 14,850 weekday riders, but in fact it is carrying less than 900 riders per weekday, about 6 percent of projections.

A Houston Silver Line sits empty, which is not unusual for it even when in motion. Photo by Ricky Courtney.

Metro, Houston’s transit agency, originally wanted to put a light-rail line in the Silver Line corridor, but opposition from local residents led it to “downgrade” the line to bus rapid transit. According to Houston businessman Bill King, Metro still managed to spend $200 million on the 4.7-mile route, mostly through tax-increment financing. This was a lot less than the $500 million or so that light rail would have cost but still a lot more than necessary. Continue reading

Transit’s Minuscule Share of 2021 Travel

Public transit carried 6.4 percent of 2021 motorized passenger travel in the New York urban area. It also carried 1.6 percent in Honolulu, 1.5 percent in San Francisco-Oakland, 1.4 percent in Seattle, 1.2 percent in Chicago, and 1.1 percent in Salt Lake City. In every other urban area it carried less than 1 percent; nationwide, transit carried just 0.7 percent of all motorized urban travel.

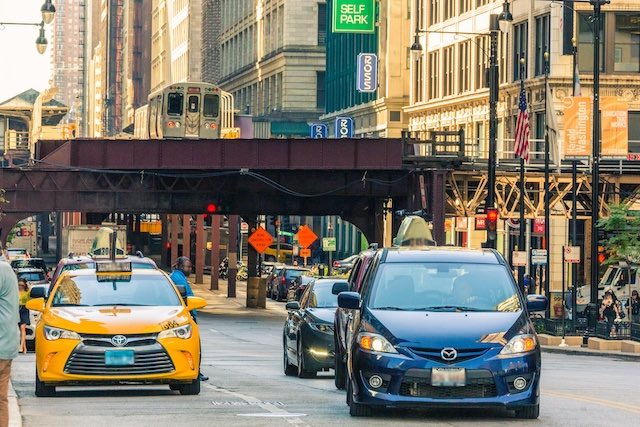
Chicago transit carried 1.2 percent, autos the other 98.8 percent of motorized passenger travel.

I calculated these numbers by comparing passenger-miles in the 2021 National Transit Database, which was released last fall, with daily vehicle miles of travel (DVMT) by urban area in table HM-72 of Highway Statistics, which was recently released by the Federal Highway Administration. To make the numbers comparable, I multiplied DVMT by 365 to get annual data and by 1.7 to account for vehicle occupancies, 1.7 being the result when dividing passenger-miles by vehicle-miles in Highway Statistics table VM-1. These numbers don’t include walking, bikes and e-bikes, or scooters, but they do include motorcycles. Continue reading