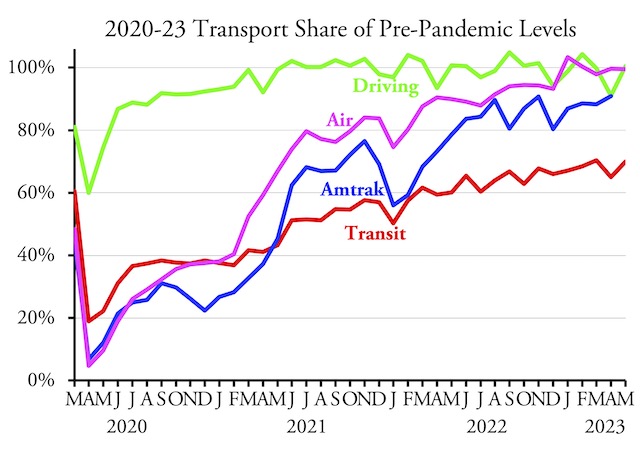
Americans drove more miles in May 2023 than the same month of 2019, according to data released by the Federal Highway Administration earlier this week. Transit ridership, however, was still less than 70 percent of 2019 levels, according to the Federal Transit Administration’s latest data.
At 69.9 percent of pre-pandemic levels, transit ridership was very close to 70 percent, a threshold it has breached only once since March 2020. To be fair, Cleveland’s regional transit agency is late in reporting ridership numbers. Though the agency carries only 0.3 percent of the nation’s transit riders, when its numbers are added, the national total for May will slightly exceed 70 percent of 2019.
Transit agencies across the country are planning to spend billions of dollars on infrastructure expansions even as many say they need bailouts due to lost fare revenues. But does anyone really believe that ridership will ever recover to 100 percent of 2019 levels? Or that they may eventually recover to 2014 levels, which were 8 percent higher than in 2019?
In almost every respect, the pandemic is over. No one is required to wear masks, transit agencies have stopped bragging about how they are sterilizing their vehicles once a day, and just about everyone who is going to return to an office or other worksite has already done so. There is little reason to think that ridership will spontaneously return to pre-pandemic levels and thus little justification for transit expansions.
Admittedly, a few transit agencies are carrying more riders than before the pandemic. Tucson transit carried 111 percent as many riders in May of 2023 than 2019; Richmond carried 103 percent. In these and other cases, recovery was achieved by reducing fares to zero early in the pandemic. But that hardly proves there is demand for transit in those regions. Besides, without fares as a check, the agencies could report any ridership numbers they want and no one could verify whether the numbers are correct.
Meanwhile, transit in many regions that are historically more reliant on fares is still doing poorly. Transit carried less than 60 percent of 2019 numbers in nine of the nation’s 20 largest urban areas: Atlanta, Chicago, Detroit, Minneapolis-St. Paul, Philadelphia, Phoenix, San Francisco, St. Louis, and Washington. Four of these — Chicago, Philadelphia, San Francisco, and Washington — are among the six regions where transit was most important before the pandemic, carrying 60 or more trips per capita, the other two regions being New York (74%) and Boston (65%).
In contrast, transit carried more than 75 percent of 2019 numbers in just five urban areas: Houston, Los Angeles, Miami, San Diego, Tampa-St. Petersburg. None of these depended heavily on transit before the pandemic; at 43 trips per capita in 2019, Los Angeles was most reliant on transit.
While transit seems stuck at around 70 percent nationwide, Americans drove 100.4 percent as many miles in May 2023 as 2019. Driving exceeded 100 percent of pre-pandemic levels in 35 states. As usual, urban driving lagged a little behind, being just 98.5 percent of 2019, while rural driving was 103.9 percent. Still, urban driving exceeded 2019 numbers in 29 states.
Amtrak has not yet posted May numbers, but the Transportation Security Administration says that the airlines carried 99.5 percent as many travelers in May 2023 as the same month in 2019. I’ll post an update when Amtrak numbers come out.
As usual, I have posted an enhanced spreadsheet (19.1-MB) with January 2002-May 2023 transit ridership data by agency and mode. The raw FTA data are in cells A1 through JH2254. Annual totals are in columns JI through KD. Mode totals are in rows 2256 through 2274. Transit agency totals are in rows 2281 through 3279. Urban area totals are in rows 3281 through 3771. Columns KE through KG compared May and year-to-date ridership with 2019 and 2022. I have made these enhancements on both the ridership (UPT for unlinked passenger trips) and service (VRM for vehicle revenue-miles) worksheets.


I would like to see, alongside these monthly charts, another chart showing absolute number of person trips on the vertical axis. That would show the relative importance of each mode, the dominance of the driving mode, and the diminishing importance of transit mode.
Passenger-miles is a better measure of the relevance of each mode. I make such comparisons when the data are available; so far, the DOT hasn’t released transit passenger-miles for 2022 or vehicle-miles for urban areas for 2021 (table HM-72 of Highway Statistics).
I think that transit needing subsidies shows that people DO NOT find transit valuable enough to pay its actual cost.