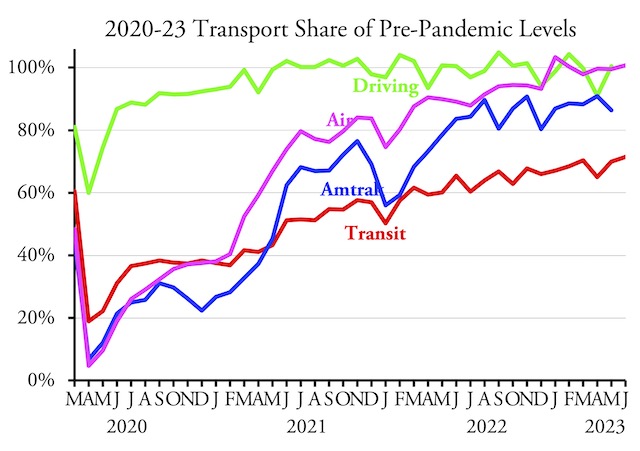
America’s transit agencies carried 71.4 percent as many riders in June 2023 as they did in the same month of 2019, according to data released by the Federal Transit Administration yesterday. This is the highest percentage of 2019 ridership since February, 2020. One reason for the gain above previous months is that June had two more business days in 2023 than it did in 2019.
Data are not yet available for highway or Amtrak travel. However, boarding numbers from the Transportation Security Administration indicate that the airlines carried 100.8 percent as many riders in June of 2023 as June of 2019. I’ll post updates for driving and Amtrak when those data are released.
Transit’s slow recovery from the pandemic is following patterns similar to those of previous months. Bus ridership (except for commuter buses) is generally doing better than rail ridership, an indication that rails (and commuter buses) tended to carry higher-income commuters who are more likely to be working at home today. Transit is doing really well in a few urban areas, including Miami (101%), Kansas City (96%), Richmond (109%), and Tucson (117%). In some of these areas, ridership is high due to no fares being charged.
Ridership is also doing better than average in the New York (74%), Los Angeles (78%), Dallas (81%), Houston (also 81%), San Diego (70%), Minneapolis-St. Paul (74%), and Tampa (87%) urban areas. However, it is doing worse than average in Chicago (60%), Philadelphia (63%), Washington (68%), Atlanta (55%), Phoenix (56%), and San Francisco-Oakland (59%) urban areas. It is also doing poorly in the Denver (60%), St. Louis (54%), Portland (65%), San Antonio (65%), and Pittsburgh (62%) urban areas.
As usual, I have posted an enhanced spreadsheet (19.2-MB) with January 2002-June 2023 transit ridership data by agency and mode. The raw FTA data are in cells A1 through Ji2256. Annual totals are in columns JI through KD. Mode totals are in rows 2260 through 2278. Transit agency totals are in rows 2290 through 3289. Urban area totals are in rows 3291 through 3781. Columns Kf through Kh compared May and year-to-date ridership with 2019 and 2022. I have made these enhancements on both the ridership (UPT for unlinked passenger trips) and service (VRM for vehicle revenue-miles) worksheets.


As a result of these changes to busy roads and streets made in Utrecht, Netherlands, each driver in this video was inconvenienced for several seconds. Multiply by the number of drivers, and billions of years of drivers’ time from their lives were lost, never to be returned 🙁
https://www.youtube.com/watch?v=X_T1iQSZt-o
“In some of these areas, ridership is high due to no fares being charged.”
Is it possible that the method for determining ridership changed when fares were discontinued?