
In November 2020, a report from McKinsey & Co. to the New York Metropolitan Transportation Authority predicted that transit ridership would recover to as high as 92 percent of pre-pandemic levels by 2025. Now McKinsey has revised that number downward to as low as 70 percent. Even that is probably optimistic considering that recent data indicate that New York subway ridership has been flat at least since February 2022, and has even declined somewhat since June.
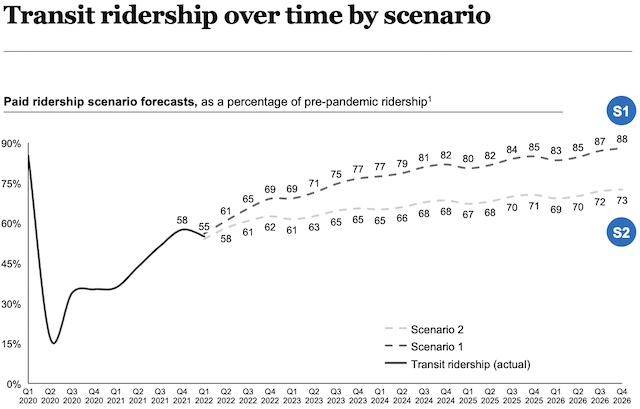
In McKinsey’s study, scenario S1 assumes people will steadily return to working in offices while the much more likely S2 assumes many will continue to work at home at least three days a week. Neither is good news for New York City transit but S2 is particularly bad, especially since even it is probably optimistic.
More than in most cities, transit in New York depends on fare revenues. Before the pandemic, fares covered more than half the operating costs of New York City transit but only about a quarter of the costs elsewhere. A decline in ridership hits the city’s transit budget harder than almost anywhere else, so it’s no surprise that both national and local media are focused on the “fiscal cliff” that MTA is likely to hurdle over when it runs out of federal COVID relief funds, probably in 2024. Continue reading


.jpg)