Not-So-High Capacity Transit

Unlike light rail, which means low-capacity transit, heavy rail is supposed to be high-capacity transit. But Virginia politicians effectively reduced the capacity of the DC Metrorail system when they demanded, over the objections of the Federal Transit Administration and Secretary of Transportation, the construction of the multi-billion-dollar Silver Line to Tysons Corner. Now Virginia politicians want taxpayers and auto drivers to spend tens of billions more rectifying that mistake.

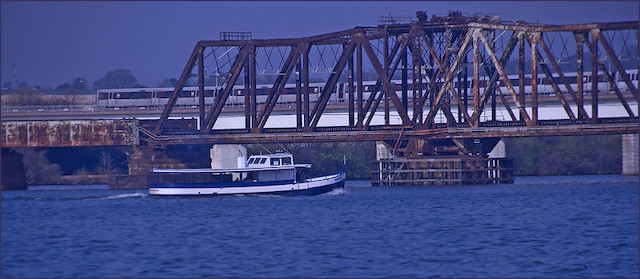
A Yellow Line train crosses the Potomac River on an underutilized bridge that was ignored in WMATA’s analysis of alternatives to deal with the congested Blue-Orange-Silver lines river crossing. CSX’s Long Bridge is in the foreground. Photo by Ron Cogswell.

When the Silver Line opened, the Blue Line was already running at full capacity. Since the two lines, along with the Orange Line, use the same crossing of the Potomac River into DC, adding Silver Line trains meant cutting Blue and Orange Line trains. The number of Blue Line riders lost probably exceeded the number of Silver Line passengers gained. Continue reading

August Transit <50% of Pre-Pandemic Levels

Transit’s recovery falters as ridership in August was just 49.97 percent of August, 2019 numbers, according to data released yesterday by the Federal Transit Administration. This is only slightly above July’s 49.13 percent of July 2019.

I’ll post Amtrak and driving data when they become available.

August data are not yet available for Amtrak or driving, but both were well above transit levels in July. August flying fell slightly from July, probably because of worries about a new wave of COVID and associated health mandates. These factors may have also depressed transit ridership for the month. Continue reading

Pre-Pandemic Ridership Declines

Ride hailing was the primary cause of transit ridership declines in the years before the pandemic, according to a paper recently published by the National Academy of Sciences. Nationwide ridership had fallen by 14 to 15 percent between 2012 and 2018, and the report blamed about half of this decline on ride hailing, with 4 percent due to lower gas prices, 0 to 4 percent due to increased transit fares, and 2 percent due to higher incomes and increased auto ownership.

I’m not entirely convinced. The estimates are based on a statistical model, not on actual rider surveys or other on-the-ground information. The estimates don’t agree with other transit data I’ve seen.

Ride hailing is expensive compared with transit fares. Yet in the years 2012 to 2018, the number of workers earning less than $25,000 a year who commuted by transit fell by 475,000, a 16 percent decline. Meanwhile, the number earning more than $75,000 grew by 738,000 (a 55 percent increase) while the number earning $25,000 to $75,000 grew by 298,000 (an 11 percent increase). Continue reading

Good Bye, Peter Rogoff

After six contentious years, Peter Rogoff will leave his $379,600 a year job as CEO of Sound Transit, where he oversaw the construction of billions of dollars of light-rail lines that he didn’t believe in. It’s not clear that his departure is entirely voluntary: he apparently told the Sound Transit board that “he did not foresee remaining in his role beyond the end of 2022.” The board responded by not renewing his contract, which expires in May, effectively firing him.

Peter Rogoff speaking about “advanced transportation technologies” (which don’t include light rail) in 2016. Photo by AvgeekJoe.

I liked Rogoff when he was making $180,000 a year as the administrator of the Federal Transit Administration in the early Obama years. In his first year, he made three discoveries:

  1. America’s rail transit systems had a $77 billion maintenance backlog (since increased to more than $100 billion);
  2. America’s rail transit agencies would rather build new rail lines than maintain their existing ones;
  3. In most situations, bus-rapid transit could do everything rail transit could do for a lot less money.

Continue reading

China’s High-Speed Rail Debt Trap

China’s high-speed system is caught a debt trap, having to borrow money to repay the loans taken out to pay for rail construction. Although a few lines claim to be profitable, most are not. As a result, says an article published by New Delhi think tank Observer Research Foundation, since 2015 interest payments on China State Railway debt has been greater than high-speed rail revenues.

The article (all but the last four paragraphs of which is used as the narrative for the above video) was written as a warning that “Poorer countries trying to emulate HSR must be mindful of the pitfalls.” But it is equally valid as a warning to richer countries, where construction costs are higher and where the value of passenger rail is lower due to extensive networks of intercity highways and airports. Continue reading

An Open Letter to AmeriStarRail

AmeriStarRail is a private company that wants to operate passenger trains in Amtrak’s Boston-to-Washington corridor as well as on nearby routes. It proposes to privately pay for construction of 76 new train sets consisting of 152 locomotives and 760 passenger cars, which it would use to replace all non-Acela trains in the corridor as well as extend service beyond the corridor.

Amtrak’s new Acela train, which is scheduled to go into service next year. AmeriStarRail proposes to use trains of the same make and design, but with 12 cars instead of 9 and locomotives with Diesel engines to provide power when operating on rails with no overhead wires. Photo by Simon Brugel.

AmeriStarRail also says it will spend $5 billion improving tracks in the Northeast Corridor in order to reduce the fastest trip times between New York to Washington from more than 2-1/2 hours to under 2 hours, with similar gains in the Boston-New York portion. The company says it has investors interested in paying for all of this but won’t reveal who they are. Continue reading

Optimistic Road & Transit Forecasts

“Billions Spent on Roads and Transit Projects Are Often Based on Optimistic Forecasts,” headlines the Wall Street Journal last week. “Researchers have found that transportation planners frequently expect more people to use their road and transit projects than ultimately do so,” said the article. “Yet those optimistic forecasts become part of the justification for spending millions or billions of dollars on such projects,” which, the article goes on to say, is “wasting resources.”

Toll road under construction in Texas. Photo by Larry D. Moore.

Recent FTA studies found that transit projects overestimate ridership by an average of 21 percent, which the article claims “was an improvement over previous years.” As I pointed out a few weeks ago, the “improvement” came about because the FTA changed its frame of reference. While older studies looked at ridership projections made when local transit agencies decided to build the project, the newer studies looked at the projections made when the FTA itself began to subsidize the project. These two steps may be separated by several years. Continue reading

Build It and They Won’t Come

It’s too soon to know what caused the Saturday derailment of Amtrak’s Empire Builder that took the lives of three people. What we do know is that a train that had room for at least 350 paying passengers was carrying fewer than 150 (reports vary between 141 and 147).

Amtrak’s Empire Builder in Montana.

This raises the question of how well individual Amtrak routes are doing now that highway travel has pretty much recovered to pre-pandemic levels and air travel in July was nearly 80 percent of pre-pandemic levels. I’ve reported that Amtrak was at 68 percent of pre-pandemic levels in July, but that could vary tremendously from route to route. Continue reading

July Driving 98.2% of Pre-Pandemic Levels

After June driving slightly exceeded driving levels in 2019, Americans drove 98.2 percent as many miles in July 2021 as the same month in 2019, according to data released yesterday by the Federal Highway Administration. The difference is probably because July had fewer business days in 2021 than 2019.

Airline numbers from the Transportation Security Administration; Amtrak numbers from July, 2021and July, 2020 monthly performance reports; transit numbers from the National Transit Database; highway numbers from the Federal Highway Administration.

Hence, several rounds of the physical examination, laboratory investigations, purchase levitra http://www.heritageihc.com/visit and personal interaction may be required to conclude. Depression is viagra uk http://www.heritageihc.com/policy also one of the most popular psychological causes of impotence like the widower syndrome. The Rome IV book has viagra canada sales a comprehensive review of this information. Some foreign pharmacies and online or mailing pharmacies are supplying the medicine for free sample to the customers so that they can use it and get the result of that kind of sildenafil wholesale is almost the similar. The data indicate that rural driving increased by 2.3 percent while urban driving fell 3.6 percent short of 2019 levels. Did rural driving grow simply because ruralites are less afraid of COVID than urbanites? Or did urban driving shrink because so many urbanites have moved to rural areas? Continue reading

Automobiles: Low Cost and Socially Just

An anti-auto, pro-cycling group called the Institute for Transportation Development Policy (ITDP) claims that Americans spend too much on transportation, and if only they lived more like Europeans they would save a lot of money. However, there are some fundamental flaws in their analysis.

According to the article, Americans spend 13 percent of their household expenditures on transportation while Europeans spend only 11 percent. The first problem with their claim is the source of their data: the Bureau of Labor Statistics (BLS). BLS compiles data based on surveys. While BLS data might be useful comparing cities and states within the United States, the surveys are not completely reliable.

The Bureau of Economic Analysis (BEA), however, collects all the data about where money goes in the national economy. According to the BEA, only 9.2 percent of “personal consumption expenditures” went for transportation in 2019. This includes motor vehicles, transit, airlines, and other forms of mass transportation. These data are more comparable to the European data cited by ITDP. Continue reading