Forced to Drive?

Although the Antiplanner likes to keep up with the latest technologies, I’ve hesitated to use Twitter. As someone who finds it easier to write a 5,000-word policy paper than a 500-word op ed, the 140-character limit for tweets is painful to think about. But, in case you haven’t heard, I started tweeting last week under the name, of course, of @antiplanner.

So I received a tweet yesterday from the Antiplanner’s loyal opponent, Michael Setty, saying, “We improve the lives of Americans the less we force them to drive.” (Followed by, “And robocars won’t save us,” but I’ll focus on his first tweet here.)

Setty is paraphrasing Minnesota planner Charles Marohn who argues that transportation planners need to change the emphasis from increasing people’s mobility to reducing the amount we “force them to drive.” This is hardly new: the notion that some mysterious conspiracy has forced Americans to drive has underlain a lot of urban planning for the past several decades. It is pure baloney.

Continue reading

Good-Bye, Ms Scott

Under fire from Massachusetts Governor Charles Baker for “unacceptable” interruptions in transit service, Massachusetts Bay Transportation Authority’s general manager, Beverly Scott, has resigned from her post. The immediate cause of those service interruptions, of course, was Boston’s record fall of more than six feet of snow in the past two weeks alone.

The underlying cause of those interruptions, however, is the aging and decrepit nature of the transit system. Burdened by $5 billion in debt that demands $422 million in mortgage payments a year–a full 22 percent of the agency’s budget that ought to be going to maintain and rehabilitate the system–the T was simply ready to fail.

This failure can’t truly be blamed on general manager Scott, who has worked in Boston for little more than two years and before that was working for Atlanta’s transit system. Indeed, the blame belongs to politicians who agreed to borrow money to build rail transit extensions. Indeed, some of the blame could be put on Governor Baker himself, who helped develop the finance plan for Boston’s Big Dig.

Continue reading

Boston’s Little Dig

The Massachusetts Bay Transportation Authority (MBTA or “the T” for short) has a problem. It has a $3 billion maintenance backlog, and must spend $470 million a year just to keep that backlog from growing. It has all kinds of wonderful plans to close that backlog, but those plans are all in the future. In the meantime, its latest budget proposal spares less than $100 million for maintenance.

So suppose someone offered the T a billion dollars. Heck, suppose someone offered it $2 billion. What percent of this money do you think the T would spend on maintenance?

Score a point if you guessed zero, for MBTA is currently spending $2 billion–half from the state and half from the feds–building a 4.3 mile extension of its Green light-rail line from Cambridge to Medford. When completed, this line is projected to increase the T’s total ridership by 7,000 “new” transit trips per day. Since the T currently carries about 1.4 million trips per weekday, the extension will increase ridership by 0.5 percent.

Continue reading

Most Americans Want a House in the Suburbs

Most Americans are happy with their commutes and would be willing to trade off even longer commutes in order to live in more desirable housing, according to a survey by YouGov. Moreover, the detailed results indicate that these preferences are almost as strong among 18-29 year olds as among older age classes. YouGov describes itself as a “market research and data company.”

Three out of four people in YouGov’s sample of 1,000 drive to work while 14 percent take transit. Since the Census Bureau’s 2013 American Community Survey found that 85 percent of Americans drive to work and only 5 percent take transit, it seems likely that YouGov’s sample was skewed to big cities where transit commuting is more popular. New York, San Francisco, and Washington are the only major urban areas in which more than 14 percent of commuters take transit to work.

This makes YouGov’s other survey results even more striking. The numbers suggest that anecdotes indicating that large numbers of Millennials want to use transit and live close to jobs aren’t supported by the facts. Among other things, the survey found that differences in commuting and other preferences between Democrats and Republicans are greater than between people in their 20s and people in their 50s.

Continue reading

Say No to the Purple Line

The Washington Business Journal published an op ed casting doubt on the proposed, $2.4-billion Purple light-rail line in Maryland suburbs of DC. Since the article is behind a paywall, the Antiplanner is taking the liberty of reproducing it here.

The Journal edited out a few paragraphs; while I’m not complaining, I reinserted them here for sake of completion. Those paragraphs are in italics.

Guest Comment: The Purple Line? No thanks

Washington Business Journal: Feb 6, 2015, 6:00am EST
Randal O’Toole

In the wake of Larry Hogan’s election as governor, Maryland has been inundated with propaganda claiming the Purple Line light rail from Bethesda to New Carrollton will do everything from relieve congestion to revitalize the economy. This is all hogwash.

Continue reading

Outrageously Expensive Transit

The average cost of light-rail construction has grown to nearly $200 million per mile, according to data in the Federal Transit Administration’s 2016 proposal for capital grants to transit agencies under the “New Starts/Small Starts” program. This is up from $176 million a mile in the 2015 plan.

San Diego, which started the light-rail craze when it built the nation’s first modern light-rail line in 1981 at an average cost of well under $10 million per mile–less than $18 million per mile in today’s dollars–wants to spend $194 million per mile on a new Mid-Coast line. Boston, which can’t afford to maintain its existing increasingly decrepit rail system, wants to spend $489 million per mile on a 4.7-mile extension of one of its light-rail lines. The least-expensive light-rail line in the budget is a 2.3-mile extension to an existing light-rail line in Denver costing a mere $98 million per mile, nearly twice as much as the least-expensive new light-rail line in the 2013 plan.

Streetcars, which were supposed to be cheap, are costing an average of $59 million a mile, up from $46 million a mile in last year’s plan. That’s less than a third the average cost of light rail today, but still more than three times as expensive as San Diego’s original light-rail line. (I’m counting the Tacoma rail line as a streetcar, as it uses equipment that is nearly identical to the Portland streetcar; Sound Transit and the FTA call it light rail mainly to justify taxing Tacoma residents to help pay for the outrageously expensive light-rail lines being built in Seattle.) The FTA proposes to fund another streetcar line in Charlotte, and streetcars in Sacramento and Fort Lauderdale are also in the plan though not recommended for immediate funding.

Continue reading

Why Are the Buses Empty?

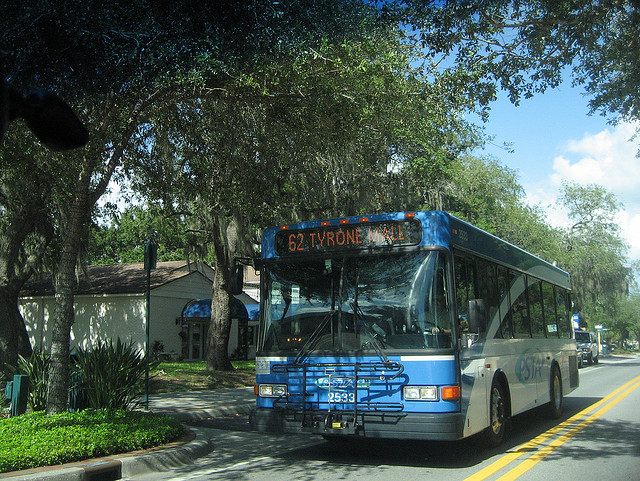
Many taxpayers get irate when they see huge buses taking up road space with almost no passengers on board. Transit agencies tint or screen bus windows either to reduce air conditioning costs or to allow billboard-type advertising, but to an outside observer it looks like they are trying to cover up the fact that so many seats are empty.


Is this bus full or empty? It is difficult to see through the tinted glass, but since it is in Pinellas County, Florida, whose buses carry an average of just 7.7 riders, it is likely to be on the empty side. Flickr photo by Bill Rogers.

According to the 2013 National Transit Database, the average urban transit bus (including commuter buses and rapid transit buses) has 39 seats but carries an average of just 11.1 people (calculated by dividing passenger miles by vehicle-revenue miles). That’s actually an improvement from 2012, when the average load was 10.7 people. But it’s a big drop from 1979, when the average loads appear to have exceeded 15 people.*

Continue reading

More Taxes Equal More Pork

While many interest groups are promoting increased federal spending on infrastructure on the grounds that it will spur economic growth, the Washington Post reports that the “benefits of infrastructure spending [are] not so clear-cut.” Yet there is a simple way to determine whether a particular infrastructure project will generate economic benefits.

Spending on transportation infrastructure, for example, generates benefits when that new infrastructure increases total mobility of people or freight. New infrastructure will increase mobility if it provides transportation that is faster, cheaper, more convenient, and/or safer than before. 

In 1956, Congress created the Interstate Highway System and dedicated federal gas taxes and other highway taxes to that system. The result was the largest public works project in history and one of the most successful. Today, more than 20 percent of all passenger travel and around 15 percent of all freight in the United States is on the interstates.

Continue reading

Late Night Boston

What gives transit riders such an incredible sense of entitlement? The state of Massachusetts has to close a $175 million budget gap. The Massachusetts Bay Transportation Authority (MBTA or “the T” for short) is still suffering from a huge maintenance shortfall. Yet Boston transit riders think they should get 24-hour transit service, no matter what the cost or how few people use it.

An experiment with late-night transit service–running certain buses and trains until 2:30 am instead of just 1:00 am–has attracted an average of just 17,000 riders per day, or less than 12,000 per hour, at an annual cost of $13 million. For comparison, before the experiment began, the T carried nearly 1.4 million riders per weekday, or close to 700,000 per hour for the 20 hours the system had been open. Plus, at least some of those 17,000 riders would have used the T anyway, just at an earlier hour.

Transit advocates say longer hours are needed to “retain talented young professionals and tech workers while boosting night life at the same time.” But when the T asked the “corporations that could ultimately benefit from the service by retaining young talent” to contribute to late-night operating costs, they got less than 7 percent of the cost of extending service hours.

Continue reading

2013 Transit Data

Bus ridership declined in 2013, but rail ridership grew, according to the 2013 National Transit Database. The Federal Transit Administration posted the database recently, which you can download in the form of data tables or in database-formatted spreadsheets. The data tables are easier to read, but the database is easier to use to make calculations of totals, averages, etc.

The database comes in 20 separate spreadsheets for such factors as ridership, operating costs, and fares. The data tables are in 30 spreadsheets. As usual, the Antiplanner has combined the most pertinent data into a single spreadsheet that includes everything from population to energy consumption. This file is similar to those for previous years, but I’ve added a few columns.

As in the past, the spreadsheet is divided into three parts. The first 1851 rows list data for every transit agency and every mode used by each agency. The middle 50 or so rows summarize the data by mode. Since a few agencies and modes failed to report energy consumption, the totals for those that did are listed separately to allow accurate calculations of average energy consumption. Finally, the last 380 rows give totals by urban area.

Continue reading