Stop Saving Me Money: It’s Too Expensive

A new study finds that Cleveland transit riders save $51.8 million a year taking transit rather than using their own vehicles. That sounds impressive until you realize that the Greater Cleveland Regional Transit Authority (RTA) spends $268 million more on operations and maintenance than it collects in transit fares. In other words, taxpayers spent $5 for every dollar supposedly saved by transit riders.

The study also claims that RTA’s economic impact on the region is $322 million a year. Considering the agency’s total annual budget is more than $320 million, spending that money digging holes and filling them up would have a bigger impact on the economy.

Continue reading

Excellence or Extinction?

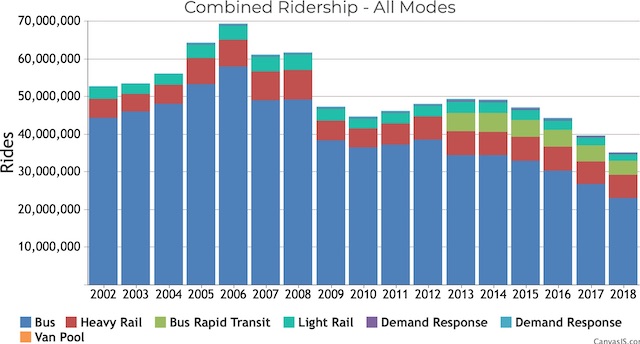
“The fiscal year ending on June 30, 2018, continued the District’s historic journey to excellence,” says the Sacramento Regional Transit District’s 2018 financial report. Really? Based on the June 2018 National Transit Database report, Sacramento RT carried 4.5 percent fewer riders in FY 2018 than it did in FY 2017. Ridership had fallen 22 percent since FY 2014 and 42 percent since 2008. Among major transit agencies, only Greater Cleveland Regional Transit and Memphis Area Transit are doing worse.

Back in 2012, RT opened its quarterly ridership reports with a chart showing ridership each year for the previous twelve years. By 2018, RT’s ridership reports had given up on showing past ridership — too depressing, no doubt — and instead opened with charts showing on-time performance. The agency’s monthly performance reports are densely packed with information but only compare the month’s ridership with the same month of the previous year, not any years before that.

Recent ridership declines happened in spite of a 7 percent increase in service (measured by vehicle-revenue miles) since 2014. However, service declined a stunning 34 percent between 2009 and 2012, no doubt due to reduced tax revenues after the 2008 financial crisis. Recent increases in vehicle miles still leave service 27 percent below 2009. Continue reading

Portland Pedestrian Priorities

Transportation policy debates are often characterized as highways vs. transit or automobiles vs. alternatives. But they are more fundamental than that. The real debate is between the engineering view and the planning view.

Engineers ask, “how are people going to get around and how can we make their travel safer and more efficient?” Planners ask, “how should people get around and how can we manipulate them into making what we think are the right choices instead of the wrong choices?”

The problem with the planning view is that it is impossible for central planners to determine what is the “right” choice for everyone. So they simplify the question and focus just on one thing, such as energy or pollution. Then they simplify still further and chant, like the pigs in Animal House, “automobiles bad; transit, walking, and cycling good.” Never mind that automobiles are more energy efficient than most transit or safer than cycling. Continue reading

Cars Getting More Energy-Efficient

The average car on the road used 2,939 British thermal units (BTUs) per passenger mile in 2016, according to the recently released Transportation Energy Data Book. This is the first time since the Department of Energy began keeping track that BTUs per passenger mile for cars has fallen below 3,000. It compares with 4,102 BTUs per passenger mile for transit buses.

Click image to download a 14-MB PDF of this book. Click here to download all or individual tables in the form of Excel spreadsheets.

Actually, according to the latest data book, BTUs per passenger mile fell to 2,998 in 2015. But the previous edition of the data book had reported 3,034; the latest edition revised the number slightly downward. Continue reading

Illinois Megafollies

An article in the Wall Street Journal this week uses the Chicago-St. Louis corridor to explain why high-speed rail “remains elusive” in the United States: it’s expensive; it takes a long time to plan and build; and it gets few people out of their cars or off of airplanes. Yet the article misses a lot of important points and could leave readers feeling that “if only we made a few changes, high-speed rail would work here.”

The article says that the planned top speed of the Illinois project is just 110 miles per hour, but it fails to note that the average speed will be just 63 miles per hour, if that. I say “if that” because (as the article also fails to mention but as the Antiplanner observed in January) the project was supposed to be done five years ago, yet today all the state is promising is that it hopes to get trains running at top speeds of 90 miles per hour this year.

In any case, according to Google, the drive time from Chicago Union Station to the St. Louis Amtrak station is 4 hours and 41 minutes, just eleven minutes longer than the train will be if and when it ever reaches its planned top speeds. Since most people have origins and destinations that differ from train stations, and since cars can leave at anytime of the day instead of the eight times a day a train happens to operate, the trains won’t pose much competition for highway travel. Continue reading

January Transit Ridership Drops 4.4%

Nationwide transit ridership in January 2019 was 4.4 percent lower than the same month in 2018, according to data released yesterday by the Federal Transit Administration. Ridership fell for every major mode, including commuter rail (-0.6%), heavy rail (-4.9%), light rail (-0.5%), streetcars (-2.6%), and buses (-4.5%). January had the same number of work days in 2018 and 2019, so that wasn’t a factor in the decline for the month.

Year-over-year ridership (February through January) fell by 2.2 percent, and also fell for every major mode: -0.1% commuter rail, -2.7% heavy rail; -1.0% light rail; -1.3% streetcars, and -2.1% buses. Ridership did grow by 44 percent in January and 20 percent for the year for the minor mode that the FTA calls “hybrid rail,” meaning Diesel-powered light rail. It grew mainly because of the opening of a new line in Oakland.

January ridership fell in 33 of the nation’s 50 largest urban areas, and year-over-year ridership fell in 38 of them. Only seven of the top fifty urban areas enjoyed ridership growth both in January and in the February-January year: Houston, Indianapolis, Austin, Providence, Nashville, Richmond, and Raleigh. Continue reading

Traffic Safety Hype

“Last year was the deadliest for pedestrians since 1990,” reports Governing magazine. Maybe; maybe not — the data for the entire year haven’t yet been published. Instead, it appears various interest groups are trying to gain publicity by being the first to report roadway safety news.

In this case, it is the Governors Highway Safety Association (which is really an association of state traffic safety agencies), which just issued a Pedestrian Traffic Safety Report. A couple of weeks ago it was the National Safety Council, which reported that 40,000 people were killed on roadways in 2018 for the third year in a row.

In fact, none of the 2018 numbers are certain because they are based on only the first six months of the year. The National Highway Traffic Safety Administration (NHTSA), which keeps the “official” data, probably won’t release final 2018 numbers until October. At least, that’s when it released 2017 numbers. It also released “preliminary” numbers for the first half of 2018 at about the same time. Continue reading

Stopping Transportation Megafollies

A commentary in Governing magazine argues that the Trump administration erred in demanding that California return the federal grants used to build its incomplete high-speed rail project. After all, the alternative to not building it is to build it, and that would require at least another $35 billion in federal funds, which Trump does not want to provide.

The other problem is that demanding a refund for incomplete projects creates a perverse incentive for states and cities to finish projects even after they have realized they are a waste of money. “Sometimes common sense wins out only after construction of a megafolly has begun,” says the commentary. “States and cities shouldn’t have to complete projects that they never should have started just to avoid returning federal money they’ve already spent.”

The commentary specifically cites the Honolulu rail line, whose costs have grown from $5 billion when it received federal funding to nearly $10 billion today. The project has been so mismanaged that the Federal Transit Administration has filed three subpoenas for thousands of pages of records. The city probably has enough money to finish 16 miles of the planned 20-mile line, but if the federal government demands a refund if the entire line isn’t finished, it will have to impose another $3 billion or more in taxes on local taxpayers to finish a white elephant. Continue reading

The Deflating Bubble

According to data released last week by the Federal Housing Finance Agency, home prices have peaked and are beginning to decline in many urban areas. Since 2018 prices in some urban areas had grown to be greater than at their peak in the 2006 bubble, it is fair to say that we have seen another bubble inflate and begin to deflate.

The above chart shows home price indices adjusted for inflation using GDP deflators for six metropolitan areas whose prices have been made volatile by growth management. Late-2018 prices in San Francisco and Seattle (as well as San Jose and some other areas) were considerably higher than in 2006, even after adjusting for inflation. Now they appear to be declining. Continue reading

Rumors Benefit Amtrak

Recently, the Wall Street Journal published a lengthy article claiming that Amtrak had a “plan” to end most or all long-distance trains. The article offered very little evidence other than oblique statements by Amtrak’s CEO, Richard Anderson. The only official statement from Amtrak quoted in the article stated that the company was “rethinking” its network but was not “prepared to announce any plans or recommendations yet.”

A week later, the Seattle Times repeated these rumors, again without any evidence except for the WSJ article. I guess no one should be surprised when rumors and speculation get reported (and re-reported) as news, but it is still disappointing.

The best evidence for what Amtrak thinks of long-distance trains comes not from off-the-cuff statements by its CEO but from what it is actually doing on the rails. The day after the Seattle Times article, Amtrak announced it would provide matching funds to help rehabilitate tracks used by the Southwest Chief, indicating it is committed to maintaining long-distance service. Continue reading