The nation’s worst-managed transit systems lose 65 cents for every dollar they spend on operating costs, fill only 42 percent of their seats, carry the average urban resident just 40 round trips per year, use more energy and spew out more greenhouse gases per passenger mile than the average car, carry fewer than 14 percent of low-income workers to work, and lost 4 percent of their customers in the last four years.
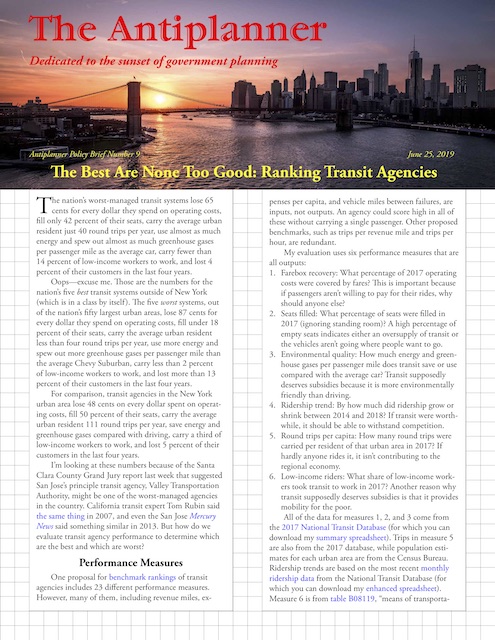
 Click image to download a PDF of this policy brief.
Oops — excuse me. Those are the numbers for the nation’s five best transit systems outside of New York (which is in a class by itself). The five worst systems, out of the nation’s fifty largest urban areas, lose 87 cents for every dollar they spend on operating costs, fill under 18 percent of their seats, carry the average urban resident less than four round trips per year, use more energy and spew out more greenhouse gases per passenger mile than the average Chevy Suburban, carry less than 2 percent of low-income workers to work, and lost more than 13 percent of their customers in the last four years. Continue reading


