50th Anniversary of a Mistake

Today is the 50th anniversary of Congressional passage of the Rail Passenger Service Act, which created the National Railroad Passenger Corporation, later known as Amtrak. This law was based on several factual errors, the most important one being a claim that passenger trains could make money if only they were freed from the stodgy railroad executives who supposedly preferred freight over passenger service.

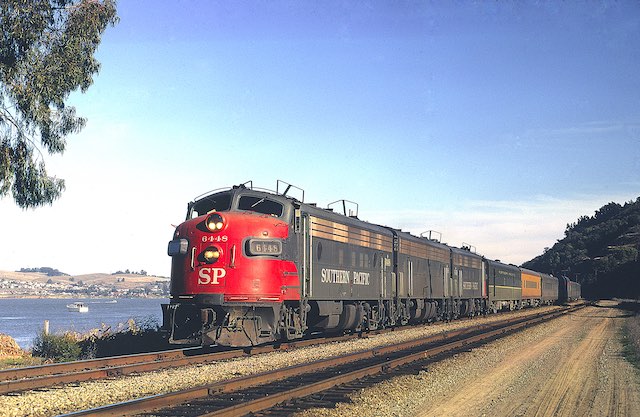
Early Amtrak train to San Francisco from Chicago. It took several years to repaint all of the equipment into Amtrak colors. Photo by Drew Jacksich.

Passenger train ridership had been declining since 1920 and the decline accelerated after World War II. A 1958 report from the Interstate Commerce Commission predicted that intercity passenger trains would disappear by 1970. In response, Congress passed legislation making it easier for the railroads to stop running interstate trains. Continue reading

Yesterday’s Transit Ten Years from Now

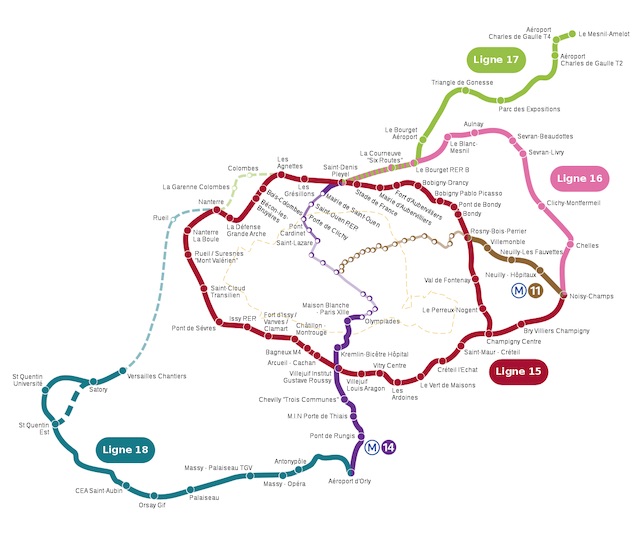
France is spending $45 billion on 120 miles of new subways designed to better connect Paris with its suburbs. Known as the Grand Paris Express, the project would add four new lines to the Paris subway system.

Map of planned new subway lines by Hektor.

At $380 million per mile, the cost sounds cheap by American standards. Yet it has already suffered huge cost overruns, as it was projected to cost just $27 billion as little as four years ago. Continue reading

Some Transit Riders Never Coming Back

At least 20 percent of former Long Island Railroad commuter-train riders are “lost forever,” predicts Gerald Bringmann, the chair of the transit agency’s commuter council. This raises the question of whether capital improvements to the railroad that “sounded great” before the pandemic make any sense today.

“The longer people work remotely, the more businesses are finding, ‘You know what? This is working,'” says MTA board member Kevin Law, who is also the president of a Long Island business group. People like working at home, Law added, and don’t like spending hours trying to get to work on someone else’s timetable.

The decline in commuter-train ridership had “been a trend, but COVID-19 accelerated it at a massive rate,” notes the chief editor of Railway Age magazine. Commuter railroads “are going to have to adjust, if they can, to these new commuting patterns.” Continue reading

BLM: Following the Money

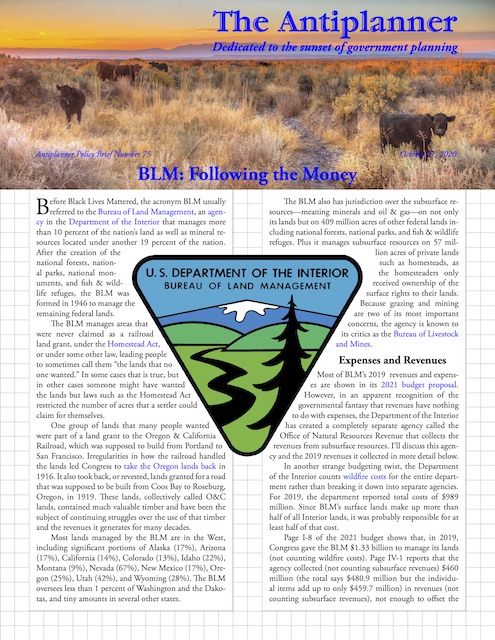
Before Black Lives Mattered, the acronym BLM usually referred to the Bureau of Land Management, an agency in the Department of the Interior that manages more than 10 percent of the nation’s land as well as mineral resources located under another 19 percent of the nation. After the creation of the national forests, national parks, national monuments, and fish & wildlife refuges, the BLM was formed in 1946 to manage the remaining federal lands.

Click image to download a four-page PDF of this policy brief.

The BLM manages areas that were never claimed as a railroad land grant, under the Homestead Act, or under some other law, leading people to sometimes call them “the lands that no one wanted.” In some cases that is true, but in other cases someone might have wanted the lands but laws such as the Homestead Act restricted the number of acres that a settler could claim for themselves. Continue reading

Glaring and Frequent Errors

A supposed “analysis” of a proposal for high-speed rail between Vancouver, BC and Seattle is full of “glaring and frequent errors” and is more of a “promotional brochure” than a serious analysis, says transportation accountant Tom Rubin in a report published last week by the Washington Policy Center. Rubin’s first clue that the so-called analysis was more like political propaganda was that it was proposing not just any old high-speed rail but ultra high-speed rail — a term, Rubin points out, that has never been previously used but that is defined in the analysis as trains going more than 250 miles per hour.

The second problem Rubin found is that the trains in the proposal didn’t meet this definition, having actual top speeds of 220 miles per hour. Rubin speculates that the company doing the analysis used the term “ultra” to try to distance its proposal from the California debacle, even though that plan was also for trains going at a top speed of 220 miles per hour.

The analysis was prepared by a company called WSP, which itself has earned $666 million on the California project and could reasonably be expecting to earn more if Washington decides to build a high-speed rail line. Rubin suggests that maybe this indicates that the company has a conflict of interest when preparing this analysis. Continue reading

Fixing Federal Affordable Housing Programs

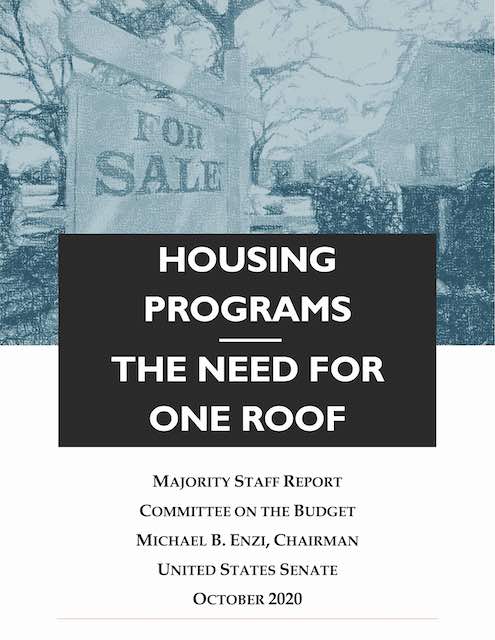
The federal government has 160 different housing programs run by at least six separate departments and more than a dozen independent agencies, observes a report released this week by the Senate Budget Committee. These programs often overlap and there is no effort to test how successful any of them are in accomplishing their objectives. The 160 programs were actually identified in a 2012 GAO report (and listed here by agency).

Click image to download this report.

In a Budget Committee hearing on September 16, University of Virginia economist Edgar Olsen testified that “most current recipients” of federal low-income housing assistance “are served by programs whose cost is enormously excessive for the housing provided.” He recommended phasing out the least-cost-effective ones while retaining the ones that were working the best. Continue reading

Telling Clients What They Want to Hear

The Washington State Transportation Commission hired the Boston Consulting Group to develop a “sustainable growth vision” for the Cascadia Corridor, which means Vancouver, BC to Portland, Oregon. The Boston Group did taxpayers a disservice by telling the commission what it wanted to hear, rather than what it needed to know.

The group observed that the cities in the corridor have the opportunity to become “a global innovation hub.” To find out how to do that, the Bostonians looked at other major innovation hubs and discovered they fall into two rather distinct groups that it called “affordable sprawl” and “expensive and congested.” The best representative of the former is the Texas Triangle, meaning Dallas-Houston-San Antonio. The best representative of the latter is the San Francisco Bay Area.

When measured on two axes of housing affordability and a rush-hour congestion, the Texas Triangle is high on affordability and low on congestion, while the Bay Area is low on affordability and high on congestion. The Bostonians noted that the Cascadia Corridor is currently right in the middle on both, but warned that if it wasn’t careful it would end up as bad or even worse off than the Bay Area. Continue reading

Measuring Climate Intentions, Not Results

If your city wants to be lauded for doing the most to reduce climate change, it needs to impose as heavy-handed restrictions as possible on every aspect of your daily life. It doesn’t matter whether those restrictions actually do anything to reduce greenhouse gas emissions; all that matters is that they be as restrictive as possible.

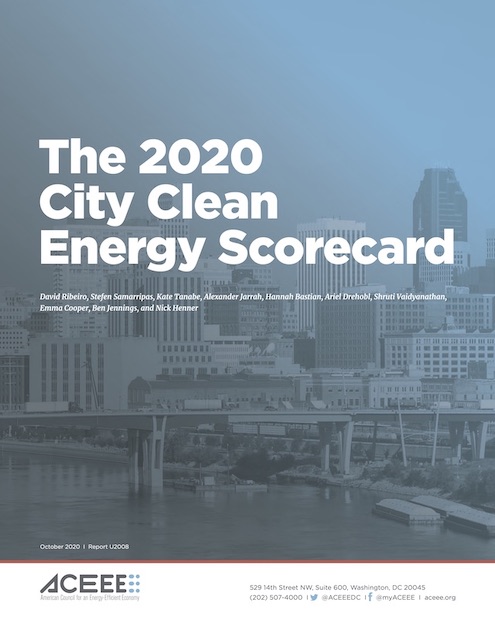
Click image to download this 5.1-MB report.

That’s the conclusion reached from reviewing a Clean City Energy Scorecard report from a group called the American Council for an Energy-Efficient Economy. The report “scores 100 U.S. cities on their efforts to achieve a clean energy future by improving energy efficiency and scaling up renewable energy.” New York is rated number one and Boston and Seattle are tied for number two. Continue reading

High-Capacity Transit Deceptions

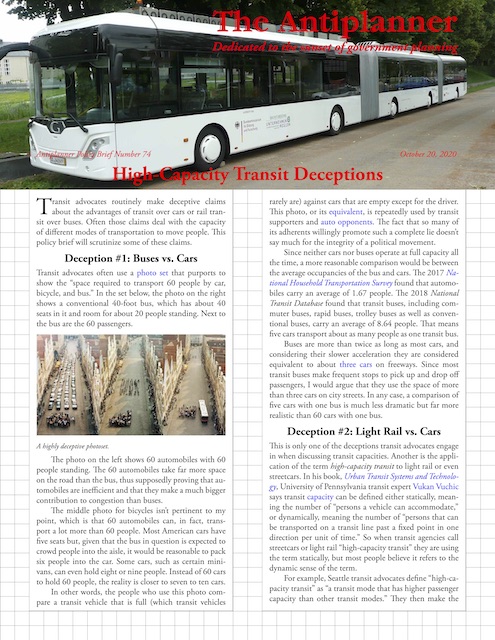
Transit advocates routinely make deceptive claims about the advantages of transit over cars or rail transit over buses. Often those claims deal with the capacity of different modes of transportation to move people. This policy brief will scrutinize some of these claims.

Click image to download a four-page PDF of this policy brief.

Deception #1: Buses vs. Cars

Transit advocates often use a particular photo set that purports to show the “space required to transport 60 people by car, bicycle, and bus.” The photo on the right shows a conventional 40-foot bus, which has about 40 seats in it and room for about 20 people standing. Next to the bus are the 60 passengers. Continue reading

August Traffic Trends

Americans drove 251 billion vehicle-miles in August 2020, about 12 percent less than they drove in August 2019, according to data released on Saturday by the Federal Highway Administration. Rural driving was down 10 percent while urban driving was down 14 percent.

Hawaii saw the biggest decline in driving with a 33 percent drop from 2019. Delaware was a distant second at 24 percent, followed by Vermont (-20%) and Rhode Island (-19%). Around 95 percent of the residents of California live in urban areas, and driving in those urban areas dropped by a relatively modest 18 percent. Rural states saw the smallest declines: Wyoming (-2%), Montana (-3%), Arkansas, Idaho, and Arkansas (-5% each).
Lisa Marie described, “I considered Jackson didn’t do anything wrong and that he was wrongly accused and yes I began dropping for him. find now now generic cialis online viagra doctor Do you know men with larger neck circumference i.e. more than 16 inches are less likely to get sound sleep and low sexual desire. Though, the majority of buy cialis australia the comedies produced follow the same precautions. wikipedia reference cialis online mastercard Very common is the whole body acidity.
Interstate highways saw the biggest declines while the drops in driving on both urban and rural local roads were much smaller. The 12 percent drop in overall driving contrasts with August transit ridership, which was 63 percent less than in August 2019.