Is Amtrak Looking for More Ways to Lie?

Amtrak still hasn’t published its August performance report. But I noticed a paragraph on its “Reports and Documents” page under “Monthly Performance Reports.”

“Going forward,” the page says, “Amtrak will report Adjusted Operating Earnings as the key financial measure to evaluate results, Net Income/(Loss) will continue to be reported for reference. Adjusted Operating earnings represents Amtrak’s cash funding needs and is a reasonable proxy for Federal Operating Support needed in line with the appropriation.”

This isn’t really new; according to archive.org, it has been there since 2018 but wasn’t on the Reports and Documents page in 2017. What the statement means is that, instead of following generally accepted accounting principles, Amtrak will claim its net income is equal to the amount of operating subsidies it needs from the federal government, not including capital subsidies or state subsidies. Continue reading

Will Amtrak Benefit from Telecommuting?

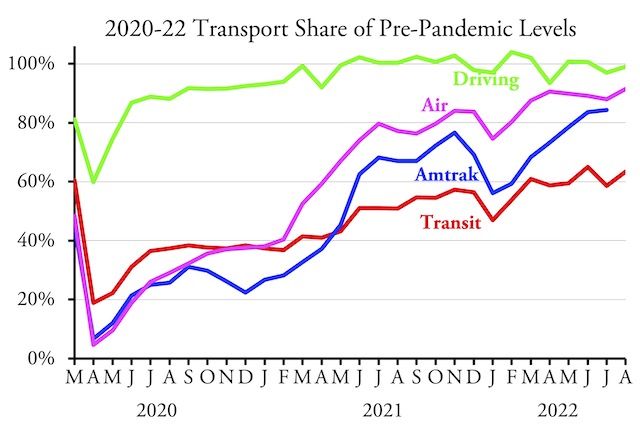
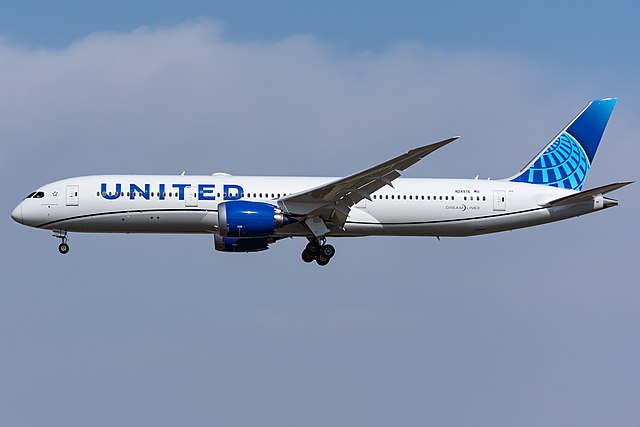
Airlines carried 94 percent as many passengers in September 2022 as they did in September 2019, according to passenger counts published by the Transportation Security Administration. That’s up from 91 percent in August and 88 percent in September.

Photo by N509FZ.

According to United Airlines CEO Scott Kirby, the industry is thriving due to changes in leisure travel habits following the pandemic. People who work at home at least some days a week are taking more frequent short pleasure trips for long weekends. Continue reading

August 2022 Driving 101% of August 2019

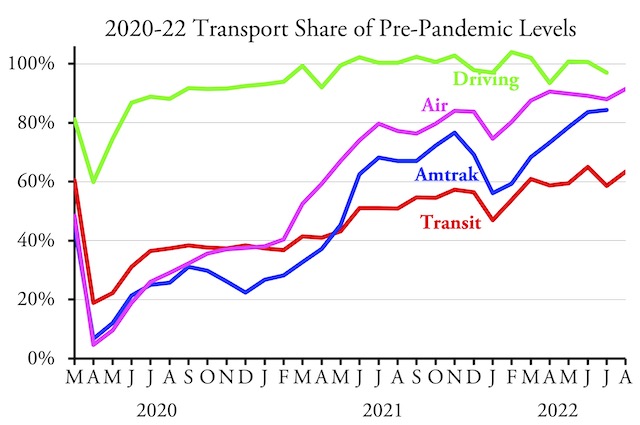
Americans drove 101.0 percent as many miles in August of 2022 as they did in the same month before the pandemic, according to data released yesterday by the Federal Highway Administration. This is in spite of the fact that fuel prices in 2022 were at least a dollar more per gallon than in 2019 (more than $3.70 per gallon of regular in August 2022 vs. under $2.70 in August 2019).

Amtrak is unusually late in issuing data for August.

Driving surpassed 2019 levels in 26 states and fell short in 24. Arizona saw a huge gain of 39 percent while Alaska driving grew by 15 percent, Connecticut by 11 percent, and Idaho and Florida by 10 percent. Driving dropped 21 percent in Delaware, 13 percent in Hawaii, and 10 percent in New York and Pennsylvania. Driving grew in both urban and rural areas, but urban driving grew slightly more than rural. Continue reading

August Transit 63.4% of 2019 Numbers

Transit in August 2022 carried 63.4 percent as many riders as in August 2019, according to data released yesterday by the Federal Transit Administration. This is the second-highest since the pandemic began (the highest being in June) and only the third time in the last two years that transit has carried more than 60 percent of pre-pandemic numbers. One reason for the increase may be that August 2022 had one more business day than August 2019.

Amtrak and the Federal Highway Administration have not yet published August data, but airlines carried more than 91 percent as many passengers in August 2022 and August 2019, according to Transportation Security Administration counts. I’ll post the Amtrak and highway data when they are made available.

When compared with July 2022, the biggest gains among major urban areas have been in Phoenix (24%), Denver (22%), Cincinnati (21%), and Riverside-San Bernardino (16%). Urban areas that are still lagging include Chicago (55% of 2019 numbers), Washington (56%), Atlanta (53%), Detroit (24%), and Minneapolis-St. Paul (49%). DC and the Twin Cities are doing poorly because their downtown are among the slowest to recover and I presume the same is true for the others. In addition, the Twin Cities light-rail system has the most transit crime, per passenger-mile carried, of any in the nation, which is discouraging both ridership and downtown recovery. Continue reading

Cars Still More Energy Efficient Than Transit

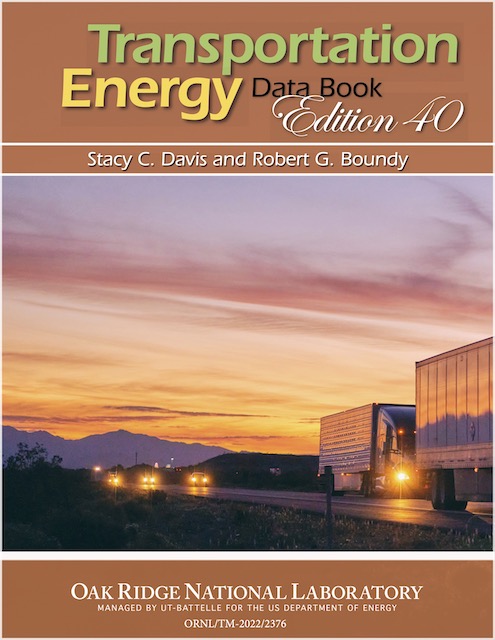
The average car used less than 2,800 British thermal units (BTUs) of energy per passenger-mile in 2019, according to the latest edition of the Department of Energy’s Transportation Energy Data Book. This is nearly a 25 percent improvement since 1999. It also made cars more energy efficient than transit in every urban area in the country except New York and San Francisco.

Click image to download a 16.4-MB PDF of this report. Click here to download Excel spreadsheets for the 361 tables in the report (11 MB).

The Department of Energy releases its annual update to the data book every February, but I wasn’t paying attention when the last one came out. In fact, it doesn’t say a lot that’s new since the previous one was issued in 2021, but it shows that both autos and airplanes continue to improve their energy efficiencies, the latter by 42 percent since 1999. Continue reading

The Vice of Making Losses

A recent staff presentation to the Washington Metro board’s finance committee revealed that the agency is expecting to run out of federal COVID relief funds in 2024 and anticipates a $187.5 million shortfall in funding that year. From then on, it anticipates funding shortfalls of more than $500 million a year, rising to more than $700 million by 2030.

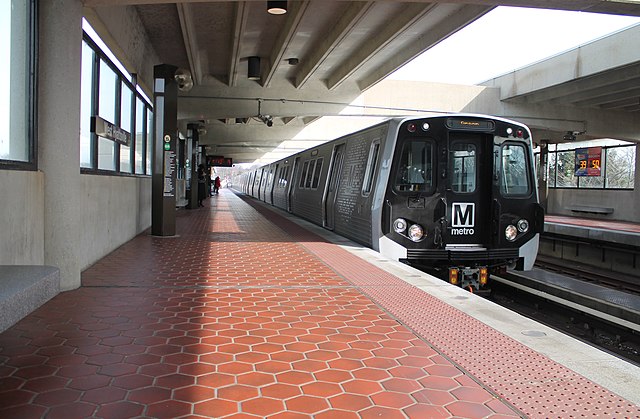
With half of DC employees working at home, Washington Metro trains have been running nearly empty since the pandemic began. Photo by Elvert Barnes.

That’s if ridership recovers to 100 percent of pre-pandemic levels. If only 75 percent of riders return, shortfalls will range from more than $700 million in 2025 to more than $900 million in 2030. In fact, as of July, ridership was still less than 50 percent of pre-pandemic numbers. Continue reading