September Driving 4.9% More Than in 2019

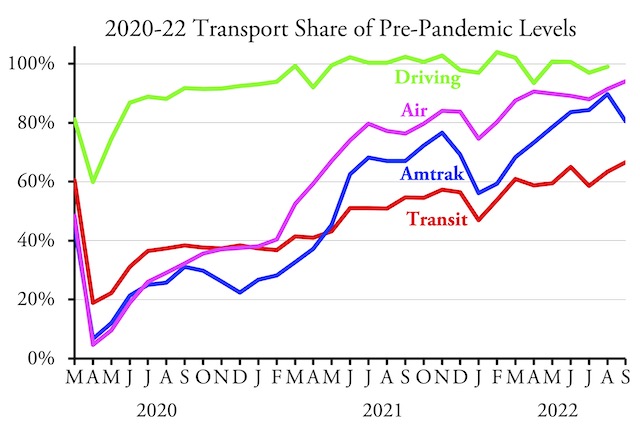
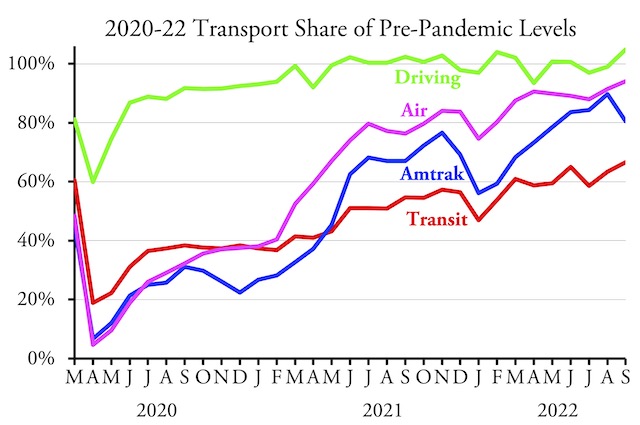
Americans drove 4.9 percent more miles in September 2022 than the did before the pandemic in September 2019, according to data that the Federal Highway Administration has finally posted on its web site. That’s the greatest amount, relative to pre-pandemic levels, of any month since the pandemic began.

Miles of driving in both urban and rural areas were greater than in September 2019 and driving was greater in 35 states. Of the states where driving still has not reached pre-pandemic levels, the biggest shortfalls were Hawaii (-23%), DC (-22%), Rhode Island (-22%), Delaware (-18%), and Pennsylvania (-11%). Driving grew the most in Arizona (33%), Alaska (19%), South Dakota (18%), Florida (14%), North Dakota (14%), Maine (13%), Louisiana (13%), Arkansas (12%), and California (11%). None of these are surprising except California, which was minus 3 percent in August. Continue reading

Transit Carries 66.6% of 2019 Riders in September

September 2022 was a booming month for the American transit industry, which carried 66.6 percent as many riders as in September 2019, according to data released yesterday by the Federal Transit Administration. This is the highest ridership recorded, as percentage of pre-pandemic levels, since the pandemic began.

Amtrak finally posted its August performance report along with the September report yesterday as well, revealing that its ridership climbed to almost 90 percent of pre-pandemic levels in August before falling to just over 80 percent in September. Air travel reached 94 percent and, as usual, driving data won’t be posted for a week or so. Continue reading

2021 Transit Data

Transit agencies carried 45 percent as many riders in 2021 as in 2019. To do so, they operated vehicles 81 percent as many miles as in 2019. However, they managed to spend 98.5 percent as much money on operating costs, according to data released yesterday by the Federal Transit Administration.

Nearly empty transit buses and trains don’t save energy or reduce greenhouse gas emissions. Photo by Jim Fischer.

The annual National Transit Database reports are based on the fiscal years of the transit agencies, which can end anywhere from March 31 to December 31. This means the 2021 data are the first full year since the pandemic began. By mid-2022, transit ridership had recovered to about 60 percent of pre-pandemic numbers, but it is likely that transit agencies are still spending as if they were getting 100 percent of riders. Continue reading