Let Cities Be What They Want to Be

An on-line site called the Dumber, er, I mean Intelligancer says that, for cities to survive, developers must be allowed to convert office buildings into housing. There are a lot of problems with this recommendation.

Your former office today. Photo by Tomi Knuutila.

There are a lot of problems with this recommendation. First, both people and jobs are moving away from the cities, so who is going to want to live in former office buildings anyway? Second, office buildings are not designed for human habitation, so converting them will be expensive, probably far more expensive than the single-family homes people are moving to. Third, if cities allow such conversions, and they don’t happen, you know what the next step will be: cities will begin subsidizing such conversions. Continue reading


Sound Planning or Just Luck?

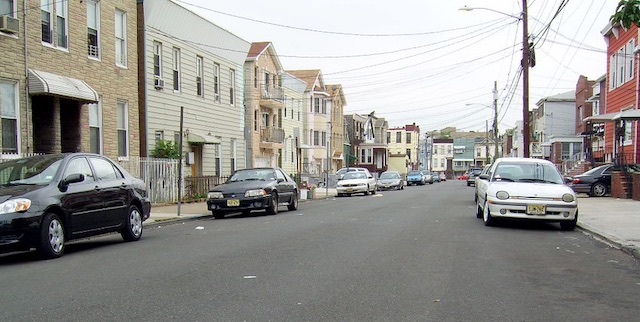
In 2018, Jersey City adopted Vision Zero, the goal of reducing traffic fatalities to zero. In the past year, it had zero fatalities on city-owned streets. Mission accomplished!

A street in Jersey City. Photo by schokker64.

A Bloomberg article yesterday breathlessly reviewed all the things the city did to reduce fatalities to zero, including roundabouts, road diets, bike lanes, lower speed limits, and the closure of one street to automobiles. Yet there isn’t any real evidence that any of these steps contributed to reduced fatalities. Continue reading

NY and CA Populations Shrinking Fast

California and New York each lost more than half a million residents between 2020 and 2022, according to population estimates issued last week by the Census Bureau. New York’s population declined by 2.1 percent and California’s by 1.2 percent.

Other big losers were Illinois, which lost 1.6 percent, and Louisiana, which lost 1.3 percent. Populations also declined in Hawaii, Massachusetts, Maryland, and Oregon, all of which have expensive housing markets. But populations declined in West Virginia, Mississippi, Michigan, Ohio, and New Mexico, which generally have affordable housing markets. Continue reading

Happy Holidays

The Antiplanner and Smokey the Antiplanning Dog wish you a happy and safe holiday and a wonderful New Year. Please free to download my 2023 calendar (16.4-MB) featuring my favorite photos of Oregon wild areas taken in 2022.

I used to take it for granted that each year will be better than the previous one. That hasn’t been true for the last three years, but maybe 2023 will buck the trend.

October Driving Greater Than in 2019

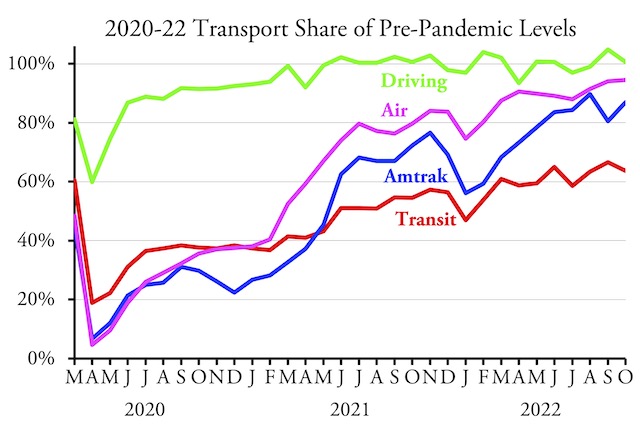
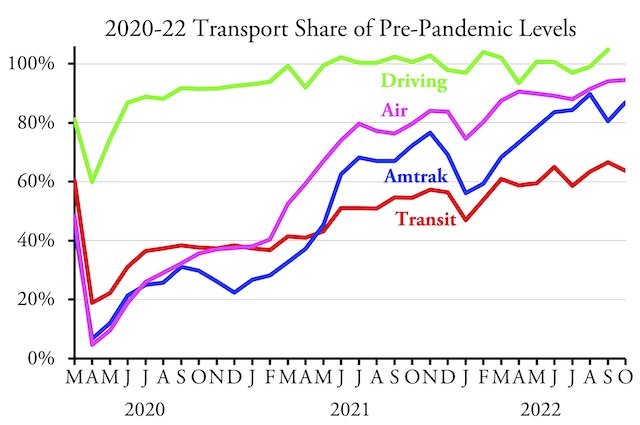
Americans drove 0.6 percent more miles in October 2022 than the same month in 2019, according to data released yesterday by the Federal Highway Administration. This is the second month in a row and the twelfth month in all that driving exceeded pre-pandemic levels since the pandemic began.

See previous posts for information about data from Amtrak and transit and air travel.

Driving exceeded 2019 miles in 26 states, while it fell short in 24 states and DC. The states that saw the greatest increase in driving, relative to October 2019 miles, were South Dakota (22.6%), Arizona (18.8%), Rhode Island (17.6%), Montana (15.4%), Missouri (11.2%), and South Carolina (11.1%). States that are still furthest from full recovery include California (-8.7%), Massachusetts (-8.0%), Delaware (-8.0%), Pennsylvania (-7.4%), and Maryland (-6.1%). Also, DC is -12.6%. Continue reading

Density and the Fertility Trap

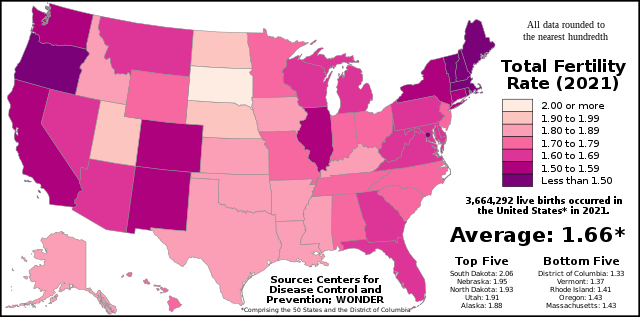
Yesterday, Tyler Cowan mentioned in the Marginal Revolution blog that he wished books on urban areas “would spend more time discussing whether dense urban areas are simply a fertility trap.” I’m not going to write a book about it, but it may be one more reason why planners’ mania for density is a bad idea.

There appears to be a correlation between state fertility rates and land-use regulation aimed at increasing urban densities. Click image to go to a Wikipedia article on fertility rates by state.

A fertility trap, sometimes called a low fertility trap, is a situation where a nation’s birth rate has declined below the replacement rate of 2.1 children per woman. Within a generation, this leads to a reduction in the number of young people working, which means — in a country that has a social security system, as most developed countries do — the number of older people that each young person must support increases. Continue reading

Engines of Equality

A recent article in the New York Times is off-target when it calls automobiles “turbo-boosted engines of inequality.” The article points to some genuine problems, but those problems are not the fault of automobiles. Nor is “accessible public transportation” the solution, as the article claims in its conclusion.

The most egalitarian transportation since the first warlord tying a horse to the first chariot made fast transport accessible only to the elites. Image from 1985 Yugo brochure scanned by Tony DiGirolamo.

The truth is that automobiles are the most egalitarian form of transportation since walking. Horses, intercity trains, streetcars, you name it, were always used mainly by the relatively wealthy and were inaccessible to the poor, especially in cities. It was only when Henry Ford developed the moving assembly line that mechanized transportation became available to the vast majority of people. Continue reading

September Air Travel Exceeded 2019 Passenger-Miles

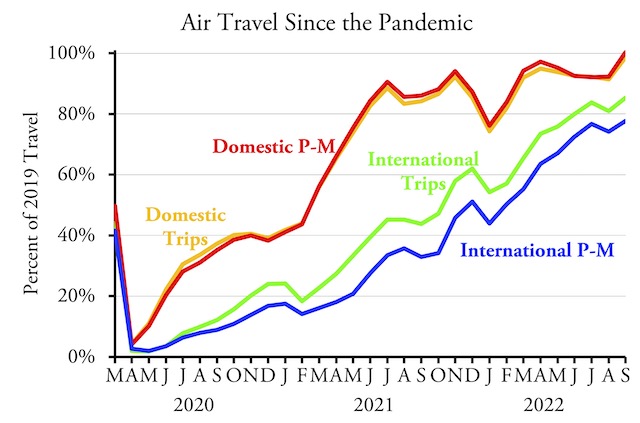
In September 2022, Americans flew more domestic passenger-miles than the same month in 2019, according to data released yesterday by the Bureau of Transportation Statistics. This is the first time domestic air passenger-miles have exceeded 2019 levels since the pandemic began.

Although the number of passenger-miles exceeded 2019 levels, the number of trips was only 98.7 percent of September 2019. This indicates that people are substituting other means of travel for some shorter airline trips. The effect, however, is smaller than I would have expected: the average domestic airline trip was 926 miles in September 2022 vs. 911 miles in September 2019, or 1.7 percent longer. For 2022 to date, average trip lengths were only 1.4 percent longer than in the first nine months of 2019. Continue reading

The Hill Family Trusts

This is a continuation of my posts about the Willamette Valley & Cascade Mountain Wagon Road.

Taking a page from his father’s example of the Minnesota mineral lands, Louis Hill turned his timber lands in Oregon into a trust. Louis, however, wasn’t as generous as his father. Instead of making Great Northern Railway stockholders the beneficiaries of the trust, he created the trust to provide a continuous income for his family. Actually, he made six trusts: one for each of his children, one for his wife, and one for himself. Each had a one-sixth undivided ownership of the timber lands. While the trusts were created in 1917, the lands earned no income for another two decades.


Congress’ policy of granting only every other square mile of land creates a distinctive checkerboard pattern. The dark green on this Google map is the Willamette National Forest while most of the light green squares are Hill trust forest lands. Highway 20 closely follows the route of the Santiam wagon road. Click here to see the same map in satellite view showing clearcuts on the Hill forest lands.

Shortly after Louis Hill acquired those timber lands, a forestry professor at UC Berkeley quit his job to start a forestry consulting firm in Portland. Dave Mason was a prophet of sustained yield forestry, which he described as “limiting the average annual cut to the production capacity” of a forest. This was in contrast to most timber land owners of the time, who generally bought land, cut the timber, and then let the land go for taxes. Continue reading

Amtrak Reaches 87% of 2019 Passenger-Miles

Amtrak carried almost 87 percent as many passenger-miles in October 2022 as it did in October 2019, according to the monthly performance report released by the state-owned company yesterday. This is a significant increase from the 80.5 percent recorded in September.

This is an update of a chart posted last week. I’ll provide another update when October driving data are available.

This is still short of the 94.5 percent carried by domestic and international airlines. Domestic air travel alone is even higher, but unfortunately those data are somewhat behind — the latest is for September, when domestic air travel was several percent higher than the average of domestic and international travel. Continue reading