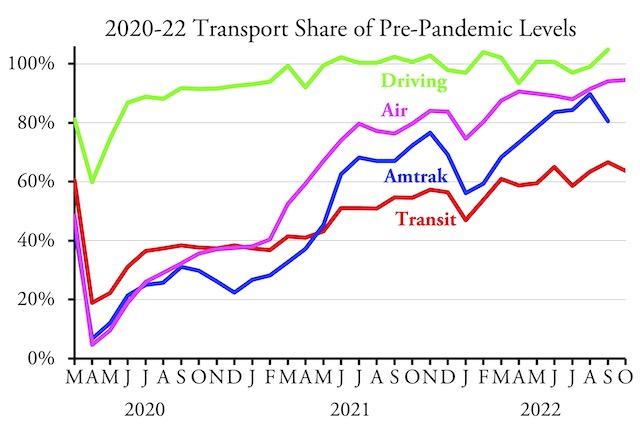
Transit carried 63.7 percent as many riders in October 2022 as October 2019, according to data released yesterday by the Federal Transit Administration. Reflecting falling fuel prices, this was a drop from 66.8 percent in September.
Meanwhile, air travel, as measured by the number of people passing through TSA checkpoints, grew to 94.5 percent of pre-pandemic levels. Data for Amtrak and highway driving are not yet available.
Fuel prices have continued to decline since October, recently falling to less than before Russia’s invasion of Ukraine. This doesn’t bode well for transit ridership, as historically, fuel prices have the greatest influence on short-term ridership changes.
As in previous months, ridership on trains is recovering more slowly than on buses. Conventional bus and rapid bus ridership is at 67 percent of pre-pandemic levels while heavy rail and light rail are only at 62 percent. Commuter bus, at 40 percent, and commuter rail, at 55 percent, are doing particularly poorly as they mainly serve downtown commuters, most of whom are now working at home. According to one recent report, downtown offices were 95 percent occupied before the pandemic but are less than 50 percent occupied today.
The FTA spreadsheet has ridership (UPT) and vehicle-revenue miles (VRM) broken down by transit agency and mode for every month from January 2002 through October 2022. I’ve posted an enhanced spreadsheet that includes these raw data plus annual totals in columns IZ through JT, mode totals in rows 2240 through 2261, agency totals in rows 2370 through 3269, and urban area totals in rows 3176 through 3765.


