Last year, Americans took about 6 billion trips on transit covering about 30 billion passenger-miles, according to the 2022 National Transit Database, which the Federal Transit Administration released late last week. This was about 61 percent as many trips and 56 percent as many passenger-miles as in 2019. Annual numbers in the National Transit Database are based on transit agency fiscal years and will not agree with calendar year numbers.
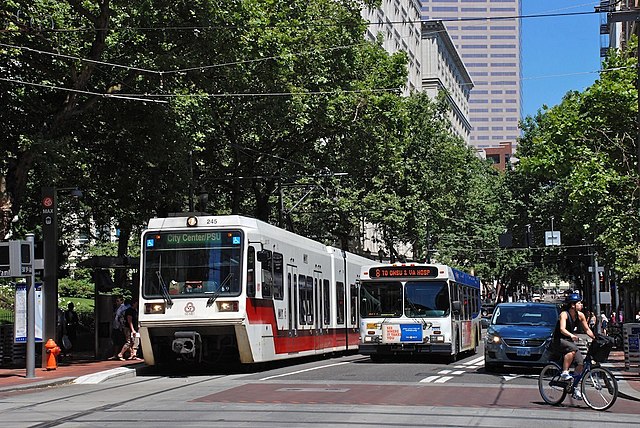
Portland’s transit mall has both buses and light rail; it’s worth noting that adding light-rail to the mall reduced the number of people that the mall could move per hour. Photo by Steve Morgan.
The 2022 database comes in the form of 29 different spreadsheets. To simplify it, I have collapsed these into a single spreadsheet that contains that data I find most useful for every transit agency and mode of transit. These data include trips, passenger-miles, service (in VRM or vehicle-revenue-miles and VRH or vehicle-revenue-hours), average weekday ridership, fares (including fares paid by riders and fares paid by organizations), operating costs, capital costs (including costs for existing service and costs for expanded service, plus unspecified costs for smaller agencies), number of vehicles, number of seats, amount of standing room, and revenue rail miles. Continue reading


