Last year, Americans took about 6 billion trips on transit covering about 30 billion passenger-miles, according to the 2022 National Transit Database, which the Federal Transit Administration released late last week. This was about 61 percent as many trips and 56 percent as many passenger-miles as in 2019. Annual numbers in the National Transit Database are based on transit agency fiscal years and will not agree with calendar year numbers.
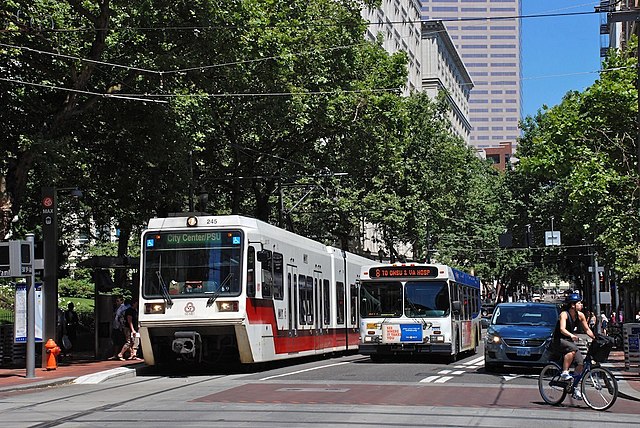
Portland’s transit mall has both buses and light rail; it’s worth noting that adding light-rail to the mall reduced the number of people that the mall could move per hour. Photo by Steve Morgan.
The 2022 database comes in the form of 29 different spreadsheets. To simplify it, I have collapsed these into a single spreadsheet that contains that data I find most useful for every transit agency and mode of transit. These data include trips, passenger-miles, service (in VRM or vehicle-revenue-miles and VRH or vehicle-revenue-hours), average weekday ridership, fares (including fares paid by riders and fares paid by organizations), operating costs, capital costs (including costs for existing service and costs for expanded service, plus unspecified costs for smaller agencies), number of vehicles, number of seats, amount of standing room, and revenue rail miles.
Update: I discovered an error in the operating expenses column. I’ve fixed the error and uploaded the corrected file at 11:26 am, October 31. If you downloaded the file before then, you probably should download the corrected file.
The data base also includes the energy consumed by each agency and mode by gallons of Diesel, gasoline, kilowatt-hours, and so forth. Based on standard factors published by the Energy Information Agency, I’ve calculated British thermal units (BTUs) and grams of carbon dioxide emitted.
For electrically powered transit, I calculated carbon outputs based on the emissions per megawatt hour reported in the Energy Information Agency’s state electricity profiles. Unfortunately, the EIA hasn’t reported 2022 data so I used 2021 emissions. Since the typical transit agency fiscal year 2022 took place half in 2021, this should not be a major error.
The spreadsheet includes the FTA’s raw data in cells A1 through X4364. Calculations of BTUs and grams of carbon, both the totals and per passenger-mile, are in columns Y through AB. Totals, with a comparison with 2021 and 2019, are in rows 4366 through 4369. Mode totals are in rows 4372 through 4393. Not all transit agencies reported energy consumption, so for calculating BTUs and grams by mode, the mode totals in rows 4395 through 4416 include only those agencies that submitted energy data.
The results show that transit used more energy per passenger-mile than the average car or light truck in every urban area and emitted more greenhouse gases than the average car or light truck in every urban area but New York. Urban area totals are in rows 4419 through 4908. Transit agency totals are in rows 4912 through 7848.
If you compare these data with those from previous years, note that the Federal Transit Administration has adopted a new numbering system for urban areas based on the Census Bureau’s code for each area. Formerly, the FTA identified the New York urban area as 1; now it is 63217. The FTA also applied new five-digit numbers for some of the smaller transit agencies that formerly were identified by an alphanumeric code. These changes won’t be important unless you try to compare these data with spreadsheets from previous years.
If you want to look at previous years, I’ve prepared similar summary spreadsheets for 2021, 2020, 2019, 2018, 2017, 2016, 2015, 2014, 2013, 2012, 2011, 2010, 2009, 2008, 2007, 2006, and 2005. The exact data included in each spreadsheet has changed slightly from year to year but most of the data can be found in every summary spreadsheet.


How about we simplify the math a little.
Transportation energy consumption in US consumes 26 Percent of ALL energy.
Overall US used 13.18 Quadrillion BTU (13.9 Exajoules), Transportation consumed 3.617 Exajoules.
American’s drove 4.7 Trillion passenger miles in 2021
Transit carried about 56 Billion miles.
Over all point is transportation consumes average 760 kilojoules per passenger mile.