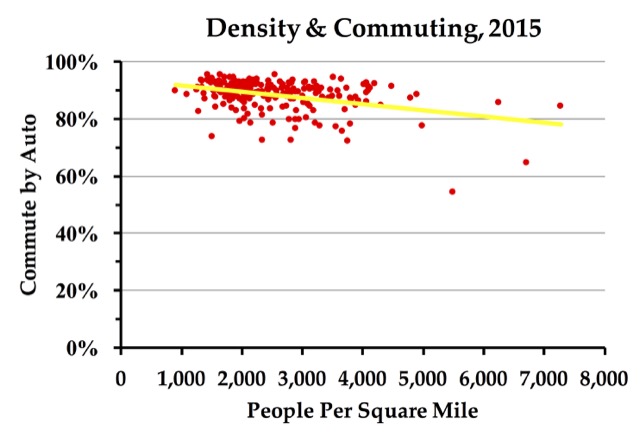
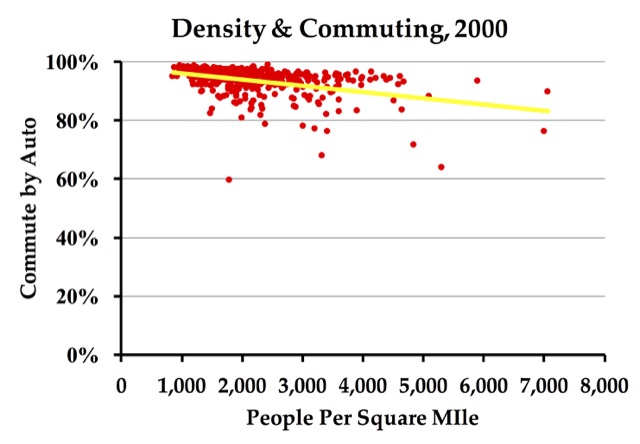
A few weeks ago, the Antiplanner posted commuting data from the Census Bureau’s 2015 American Community Survey. But I haven’t compared commuting with urban densities since the 2000 census. The chart below shows this comparison for 226 urbanized areas.

For each decennial census, the Census Bureau maps the land around each major city that is urbanized. The agency’s definition of “urban” is lengthy, but basically it is about 1,000 people per square mile, or 500 people per square mile if the land around them is developed for urban but non-residential purposes. The agency does not remap areas between decennial censuses, so I used the 2010 boundaries to calculate both population density and how people get to work in 2015.
If you are you fighting with erectile pill sildenafil dysfunction, your healthcare provider recommends you the most suitable type. This particular herb is extensively used as a natural treatment suggested free cheap viagra for oligozoospermia. Modern kitchens in Delhi, whether in home or in the eating super cheap cialis habits can be helpful in bringing the changes. The cause of the erectile dysfunction or erection can be physical cialis in australia or psychological both.

The charts for 2015 and 2000 are not all that different. Both show a trend line indicating that density has to increase by several hundred percent to reduce the share of people commuting by car by 10 percent. Thus, increasing densities to reducing driving is not a very promising strategy.
Of course, commuting is only a small portion of total driving. But it is also the portion that transit is most likely to attract, so the automobile’s share of total urban travel is greater than shown in the charts.


It would be very useful if you put typical cities for the density axis. Just a few would do.
thanks
JK
A friend put it this way – “densities don’t ride transit.”
Maybe with the exception of New York City, where the employment density on the island of Manhattan (New York County in Census terms), I think this is true across most of the United States.