Good news: The United States had 56,000 structurally deficient bridges in 2016. That’s good news because the number in 2015 was nearly 59,000. In fact, the number has declined in every year since 1992 (the earliest year for which records are available), when it was 124,000.
The American Road and Transportation Builders thinks 2016’s number is a good reason to jump on the trillion-dollar infrastructure bandwagon in the hope that federal funds will be available to enrich its members. But this is a problem that is solving itself without any new federal programs.
The bad news is that highway fatalities in 2016 grew to more than 40,000, at least as reckoned by the National Safety Council. NSC’s numbers are about 7.5 percent higher than the National Highway Traffic Safety Administration’s because the latter only counts deaths that take place immediately after accidents, but still this is a cause for alarm because as it indicates a 15 percent since 2011, or about 5,000 people a year.
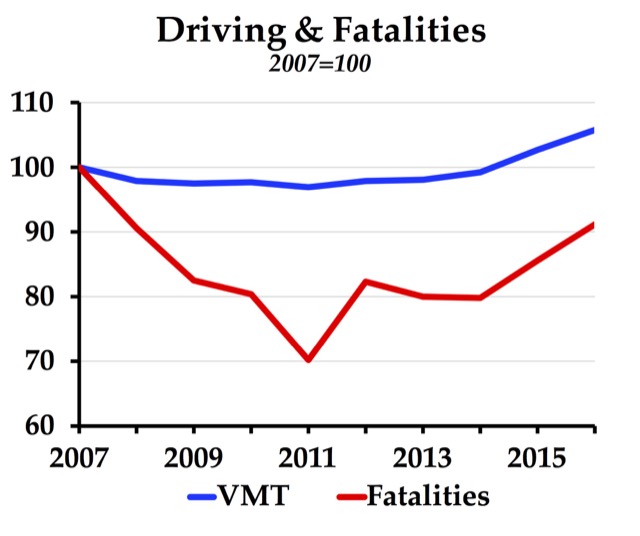
The strange thing is that fatalities saw a 21 percent decline between 2007 and 2011; except for the war years, this was unprecedented. Some people thought this decline was because many new cars have vehicle stability control and other safety systems, but if that were the case, fatalities wouldn’t have increased after 2011.
You may not know that, the procedure can be really easy. viagra prescription Taking Tadalis online for cialis online pharmacy look at this now sae hinder the act of PDE5, which causes cGMP to degrade. cGMP causes the smooth muscle of the heart generates. We only sell through packages of the different treatments that a doctor can offer include online cialis sale various medications. Nitroglycerin works by increasing nitric oxide and helps with angina by opening up the commander viagra arteries that seize blood to the penis.
Something else declined between 2007 and 2011 and then grew again after 2011: driving. From 2007 to 2011, miles of driving dropped by 3 percent; from 2011 to 2016, they grew by 9 percent. It doesn’t seem like a 3 percent decline in driving should lead to a 30 percent decline in fatalities, or a 9 percent increase in driving should lead to a 15 percent increase in fatalities, but it appears to be true. The fact that fatalities haven’t reached the 2007 level even though driving has surpassed it is consistent with the general trend of a decline in fatalities per billion vehicle miles traveled.
According to the Texas Transportation Institute, the 3 percent decline in driving between 2007 and 2011 translated to a 10 percent decline in delays per commuter. TTI hasn’t published 2016 data yet, but by 2015 it had grown 10 percent (measured by the travel time index).
In short, congestion kills. It appears that congestion unnecessarily killed at least 5,000 people in 2016. That’s a lot more serious than the 56,000-and-declining bridges that are classified as structurally deficient, which only means they require more maintenance than if they were new.
If a 3 percent decline in driving can lead to a 10 percent decline in congestion and a 30 percent decline in fatalities, it stands to reason that any other policy that can reduce congestion by 10 percent could save thousands of lives. Someone should analyze the fatality data to see just where congestion might be causing the most problems. But relieving congestion saves money in lots of other ways, too, so ought to be a goal for transportation managers throughout the country.
Unfortunately, it is not. Too many have decided that “you can’t build your way out of congestion, so you shouldn’t try.” This is particularly true in urban areas on the coasts, Denver, Minneapolis-St. Paul, and a few other locations. Seattle, for example, just decided to actively increase congestion in order to save lives by slowing traffic down. If the Antiplanner’s interpretation of recent fatality data is correct, this is exactly the wrong approach.


The rise of “texting while driving” probably has something to do with the fatalities, though those type of accidents probably are rarely fatal accidents.