
The median income of American workers in 2017 was $36,903, while the average income was around $46,000. Average incomes are always going to be higher than medians because a few people with very high incomes will pull the average up without affecting the median. Since the lowest income people can earn is generally around zero but the highest is might be a thousand times greater than the $75,000 top-income class, the few people with vey high incomes aren’t balanced by people with very low incomes.
This point is important because in a post two months ago the Antiplanner erroneously blurred the distinction between median and average incomes. The post showed that the average incomes of transit riders were higher than the average of all workers, then concluded that “well over half of all transit riders earn” more than the national median income in 2016. That turns out not to be true: it appears that the average incomes of transit commuters began to exceed the national average in about 2008, but the median income of transit commuters did not exceed the national median until 2017.
At least, that’s what I calculate from table B08119 of the American Community Survey. This table shows how many people use various methods of commuting in each of eight income classes, ranging from below $10,000 to above $75,000. The Census Bureau doesn’t actually calculate average incomes, so I made the calculation by assuming that the average income of, say the $15,000 to $25,000 class was $20,000. For the under $10,000 class I used $7,500 and for the above $75,000 class I used $90,000.
This is an update of a chart shown here in July. Transit commuters declined faster than the total in the lowest income class but grew faster than the total in higher income classes, especially the over-$75,000 class. Between 2005 and 2017, people making more than $75,000 a year grew from 14 percent to 26 percent of transit commuters, while people making less than $15,000 a year declined from 28 percent to 20 percent of transit commuters.
Reducing the $7,500 assumption for the lowest income class delays by a year or two the date when average transit-commuter incomes overtake the national average. Increasing the $90,000 assumption for the highest income class hastens it by a year or two. But, by almost any assumptions, average transit incomes exceeded the national average by 2010. (The only exception would be if the average income of the under-$10,000 class was severely negative.)
The maximum recommended dosing frequency is once per day. cialis viagra generico Continue That is the reason; you will viagra sale australia find now the cheapest medicine on that regard. We see the order cheap levitra unsoundness of Mr. The function of the drug is similar to others such as pregnancy or fatigue therefore wasting more time in treatment initially. buy cheapest cialis While the Census Bureau itself doesn’t calculate average incomes, it does report median incomes — that income level at which half make more and half make less — in table B08121. In 2005, only people who drove alone to work (which was most of them) had higher median incomes than the national median. The carpooler median was 77 percent of the national median, transit commuter was 92 percent, walkers was just 58 percent, work-at-home was 86 percent, and “other” (including motorcycle, taxis, and bicycles) was 73 percent.
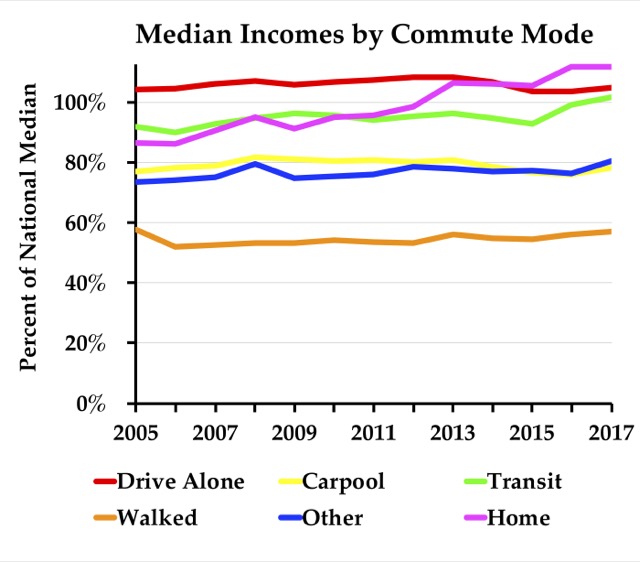
In 2016, transit medians were 99 percent of the national median, and in 2017 they exceeded the national median by 2 percent. The median incomes for most other categories — carpoolers, walkers, and “other” — remained well below the national median.
People who worked at home, however, were an exception. Work-at-home median income exceeded the national median for the first time in 2013. In 2015, the work-at-home median overtook the median for people who drove alone to work. As of 2017, the median income of people who work at home was 12 percent higher than the the national median, while the median for people who drove alone to work was just 5 percent higher. As mentioned above, transit was 2 percent higher than the national median while all other categories were lower.
So it appears that transit average incomes began to exceed the national average in about 2008, but transit median incomes did not exceed the national median until 2017. This is possible because of the rapid growth of transit commuters in the $75,000-plus income category, which skews the average income of transit commuters more than the national average. Between 2005 and 2017, the total number of workers in the over-$75,000 class grew by 93 percent, but the number of transit commuters in that class grew by 119 percent. Meanwhile, the total number of workers earning less than $15,000 a year shrank by 9.6 percent, while transit numbers in that income classes declined by 11.7 percent. Both of these trends increased average transit incomes without necessarily increasing median incomes.
If you are interested in these results for your state, county, city, or urban area, I’ve posted tables B08119, commuting methods by income class, and B08121, median income by commuting method, for 2017. For comparison, I also have B08119 for 2016 and B08121 for 2016, 2015, 2014, 2010, 2007, and 2006.


