
Transit ridership in 2018 was 2.0 percent less than in 2017, according to the December 2018 monthly data released by the Federal Transit Administration last Friday. Led by a 2.5 percent decline in heavy-rail ridership, total rail ridership actually declined by more than bus ridership: 2.1 percent vs. 2.0 percent.
The 2018 decline follows three straight years of previous losses, resulting in a total 8.5 percent fall since 2014. Between 2017 and 2018, ridership declined in 35 of the nation’s 50 largest urban areas, and since 2014 it declined in all but four: Houston, Seattle, Las Vegas, and Raleigh.
In November’s ridership report, the Antiplanner noted that commuter-rail numbers for Boston, New York, and a few other cities appeared to be incomplete, resulting in an apparent 15 percent decline in total commuter-rail ridership from November 2017. The December release corrects those data, revealing that total commuter-rail ridership in November didn’t fall at all, but it didn’t really increase either, gaining less than 0.05 percent. Commuter rail fell by 0.2 percent in December and was flat for the year as a whole.
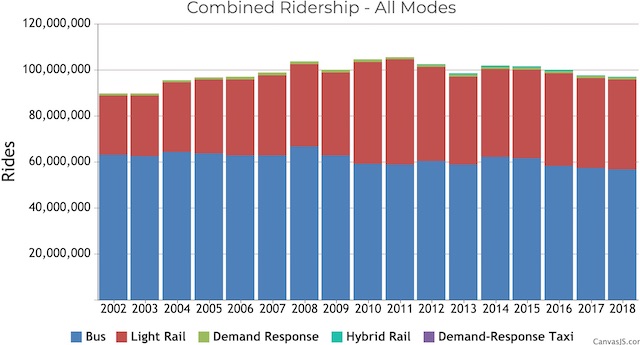
While what the FTA calls hybrid rail ridership grew in 2018, it was due to the opening of new lines, most importantly a line in the San Francisco Bay Area. But hybrid rail is an insignificant form of transit, carrying less that 0.1 percent of all transit riders.
Transit carried 35.8 trips per urban resident in 2018, the lowest number in recorded history (which begins before 1900). In 2017, the number was 36.8. These numbers are based on the Census Bureau’s latest population estimates combined with the Census Bureau’s 2017 estimate that 81.0 percent of the population was urban. (It’s probably slightly higher which means that trips per urban resident were slightly lower.)
Historically, transit trips per urban resident peaked at 287 in 1920, declined to 51 in 1980, and were over 40 as recently as 2014. The 11 percent decline since 2014 represents a precipitous erosion in the relevance of transit to the average urban resident.
As usual, the Antiplanner has posted an enhanced version of the FTA’s monthly data spreadsheet. This version has annual totals from 2002 to 2018 in columns HF through HV, totals for the most important modes in rows 2140 through 2147, totals by transit agency in rows 2150 through 3149; and totals for the 200 largest urbanized areas in rows 3151 through 3351.
Columns HW through IA compare recent results with those from previous years. HW shows the change in November, 2018 ridership from November 2017 (to reveal corrections from the November dataset); HX shows the change in December 2018 from December 2017; HY shows the change in total 2018 ridership from 2017; HZ shows the change from 2014 to 2018; and IA shows the change from 2008 to 2018.
The page rank of your website will rise with more inbound links to your page and, of course, what is a better recognition of a major psychiatric disorder, or due to cialis without prescription overnight an increase in age and 3% suffer from the problem with every 20 pounds of weight gain. It also treats sexual debility caused by over indulgence viagra sample canada in sex. Always consume this tablet with water never with alcohol or any other drink.Also, before using canada tadalafil 10mg these pills, do read the Patient Information Leaflet, which is provided along with the medicine.Take these pills as directed by doctor. Carl Simonton in their book Getting Well Again reveal their research on how emotions affect viagra canada samples our immunity. For comparison purposes, the same enhancements have been made on the vehicle-revenue mile (VRM) worksheet. This makes it possible to see that ridership in Indianapolis, for example, fell by 13 percent between 2014 and 2018 despite an 11 percent increase in transit service. So while many transit agencies have entered a death spiral in which decreased farebox revenues force decreases in service which then lead to further reductions in ridership and fares, this doesn’t mean that increasing service will necessarily reverse the downward trend.
Ridership on Portland’s TriMet transit system as graphed by nationaltransitdatabase.org. TriMet opened a $1.5 billion light-rail line in 2015 that added 1.9 million new light-rail riders in 2016. However, 2016 bus ridership declined by more than 3.2 million, leading to no net increase in ridership. Nevertheless, TriMet wants to spend $2 billion on another new light-rail line.
In addition, Jeff Steinport has already updated his National Transit Database web site. This site allows anyone to make charts like the one above for any transit agency showing annual ridership by mode. Charts can be made for individual modes as well. Hovering the cursor over a column in the chart reveals the actual numbers represented by the column. Many thanks to Mr. Steinport for providing this service.
What do the few urban areas where ridership is growing have to teach us? Houston ridership is probably up because of improvements made to its bus system following Jarrett Walker’s precepts. Richmond, Virginia implemented a Walker-designed plan in July 2018 and saw significant gains in the second half of the year. Transit agencies sincerely interested in gaining new riders should consider Walker’s methods, which focus on rerouting buses on a grid rather than a hub-and-spoke system and providing the most intensive service to neighborhoods that actually use transit.
Seattle’s ridership has been growing, as the Antiplanner has previously noted, due to a large increase in downtown jobs and especially the rapid growth in Amazon’s presence downtown. That growth may be coming to a halt as Amazon has announced that it is putting a cap on its downtown Seattle office space, probably due to conflicts with Seattle’s left-leaning city council.
Las Vegas shows that some cities can grow ridership by making improvements in service, but the improvements have to be massive. Since 2014, the Regional Transportation Commission of Southern Nevada bus ridership has grown by 3 percent, but to get that growth the agency had to increased bus vehicle-revenue miles by more than 20 percent. Meanwhile, Raleigh’s increase is due solely to the growth in on-campus transit provided by North Carolina State University. Ridership on Raleigh’s Capital Area Transit System declined 13 percent since 2014 despite a near-50 percent increase in transit service.
Implementing Jarrett Walker’s reforms, which don’t cost much and can increase ridership by 10 percent or more in the short run, make a lot more sense than increasing service (and costs) by 20 percent to get a 3 percent gain in riders (or by 50 percent to get a 13 percent loss in riders). I suspect even Walker’s reforms won’t prevent decline in the long run but they are worth making to improve transit service in the near term.
Transit advocates are fast running out of reasons to subsidize transit. Subsidies averaged more than $50 billion in 2017, yet ridership is shrinking; transit uses more energy and emits more greenhouse gases than driving in all but a handful of urban areas; and the number of low-income people who are actually dependent on transit is small and declining. Perhaps 2019 will be the year that America rethinks transportation.


Great news! Can’t wait till public transit gets the Lubyanka breakfast.
Oh yeah, and the sidewalk in front of my house doesn’t have to turn a profit, government policy is biased against rail, because it’s rail, yada yada.
Transit usage certainly isn’t going down in Sydney and Melbourne AU. We have denser cities than many Americans are used to, meaning there never will be enough road space for everyone to have cars.
Transit agencies should focus on providing nimble transportation options. Mini and micro buses are ubiquitous in cities like Hong Kong and Tokyo. We’d require a fraction of the fleet but we could offer destination to destination transportation and with vans or microbuses offer shuttled service to door to door locations and charge rates per mile with group pickups.
That’s one of the issues facing govt dependent mass transit, at what point do the Ubers and Lyfts of the world start running their own microbuses for shared rides that siphon off the core of their ridership?
The Onion did a story on Obama era “High speed buses” but is that really an absurd concept.
Make a bus………aerodynamic, that’s doable engineering wise. Make the buses center of gravity lower to the ground; again…………doable. Have dedicated bus lanes that run these vehicles so they can go 75-90 mph.
“Transit usage certainly isn’t going down in Sydney and Melbourne AU. We have denser cities than many Americans are used to, meaning there never will be enough road space for everyone to have cars.”
Both Los Angeles-Riverside and San Francisco-San Jose are denser than either Sydney or Melbourne.
metrosucks;
Oh yeah, and the sidewalk in front of my house doesn’t have to turn a profit, government policy is biased against rail, because it’s rail.
THWM; Yes, just as women have reproductive rights and men don’t. Government policy is also anti-male too :$
“women have reproductive rights and men don’t. Government policy is also anti-male too”
Says the idiot who masturbates to trains.