Los Angeles is “hemorrhaging bus riders,” worries the Los Angeles Times. This is supposedly “worsening traffic and hurting climate goals.”
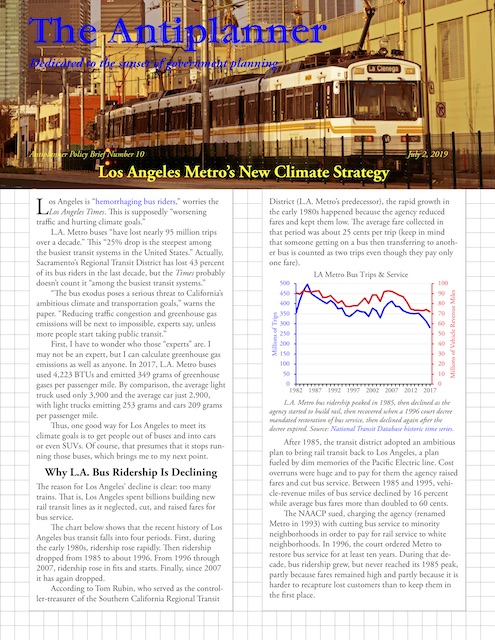 Click image to download a PDF of this policy brief.
L.A. Metro buses “have lost nearly 95 million trips over a decade,” the paper notes. This “25% drop is the steepest among the busiest transit systems in the United States.” Actually, Sacramento’s Regional Transit District has lost 43 percent of its bus riders in the last decade, but the Times probably doesn’t count it “among the busiest transit systems.”
“The bus exodus poses a serious threat to California’s ambitious climate and transportation goals,” warns the paper. “Reducing traffic congestion and greenhouse gas emissions will be next to impossible, experts say, unless more people start taking public transit.”
First, I have to wonder who those “experts” are. I may not be an expert, but I can calculate greenhouse gas emissions as well as anyone. In 2017, L.A. Metro buses used 4,223 BTUs and emitted 349 grams of greenhouse gases per passenger mile. By comparison, the average light truck used only 3,900 and the average car just 2,900, with light trucks emitting 253 grams and cars 209 grams per passenger mile.
Thus, one good way for Los Angeles to meet its climate goals is to get people out of buses and into cars or even SUVs. Of course, that presumes that it stops running those buses, which brings me to my next point.
Why L.A. Bus Ridership Is Declining
The reason for Los Angeles’ decline is clear: too many trains. That is, Los Angeles spent billions building new rail transit lines as it neglected, cut, and raised fares for bus service.
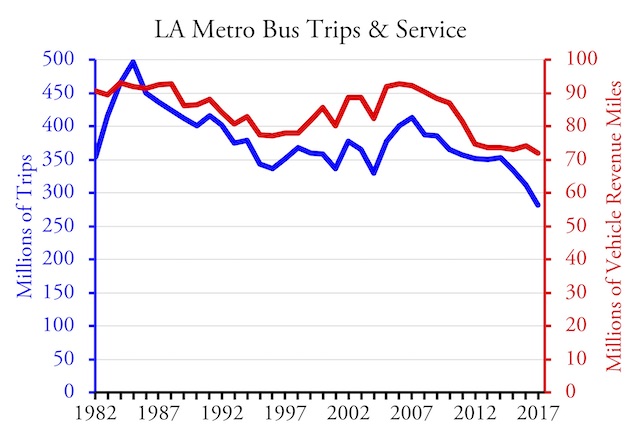
L.A. Metro bus ridership peaked in 1985, then declined as the agency started to build rail, then recovered when a 1996 court decree mandated restoration of bus service, then declined again after the decree expired. Source: National Transit Database historic time series.
The above chart shows that the recent history of Los Angeles bus transit falls into four periods. First, during the early 1980s, ridership rose rapidly. Then ridership dropped from 1985 to about 1996. From 1996 through 2007, ridership rose in fits and starts. Finally, since 2007 it has again dropped.
According to Tom Rubin, who served as the controller-treasurer of the Southern California Regional Transit District (L.A. Metro’s predecessor), the rapid growth in the early 1980s happened because the agency reduced fares and kept them low. The average fare collected in that period was about 25 cents per trip (keep in mind that someone getting on a bus then transferring to another bus is counted as two trips even though they pay only one fare).
After 1985, the transit district adopted an ambitious plan to bring rail transit back to Los Angeles, an idea fueled by dim memories of the Pacific Electric lines. Cost overruns were huge and to pay for them the agency raised fares and cut bus service. Between 1985 and 1995, vehicle-revenue miles of bus service declined by 16 percent while average bus fares more than doubled to 60 cents.
The NAACP sued, saying the agency (by now renamed Metro) was cutting bus service to minority neighborhoods in order to pay for rail service to white neighborhoods. In 1996, the court decreed that bus service should be restored for at least ten years. During that decade, bus ridership grew, but never reached its 1985 peak, partly because fares remained around 120 more than they had been in 1985 and partly because it is harder to recapture lost customers than it is to keep them in the first place.
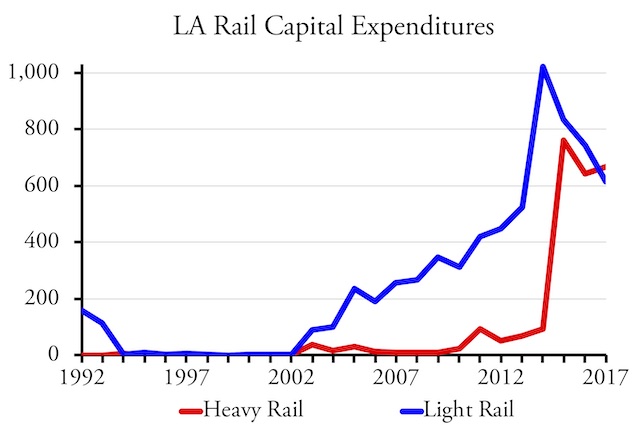
Spending on rail collapsed after the court decree, then rose rapidly after the decree expired. Capital costs are not available before 1992, which is when most of the initial spending on Los Angeles light- and heavy-rail took place.
The decree expired in 2007. In the intervening years, Metro had spent little on new rail transit, but as soon as it expired, expenditures shot up. Meanwhile, Metro cut bus service 22 percent and raised fares by another 32 percent.
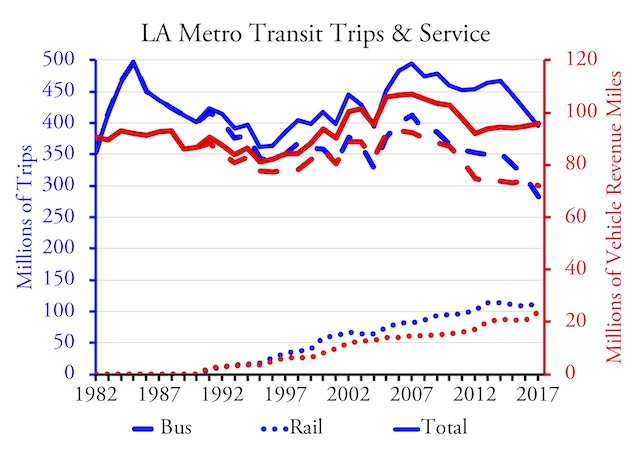
This chart is complicated, but the point is that rail ridership did not make up for the declines in bus ridership. Dashed lines are bus; dotted are rail; solid are totals.
Although Metro’s rail lines gained new riders, they weren’t enough to offset the decline in bus ridership. Between 1985 and 1996, the agency lost six bus riders for every new rail rider. Between 1996 and 2007, both rail and bus ridership grew. In the decade since 2007, Metro lost more than four bus riders for every new rail rider.
A New Climate Strategy
The good news is that L.A. Metro has discovered a successful formula for meeting climate goals: Cut bus service and raise fares, getting people off the dirty buses and into relatively clean automobiles. The bad news is that opinion leaders such as the Los Angeles Times haven’t figured this out and are pushing for increases in bus service at the expense of increased congestion and greenhouse gas emissions.
Specifically, the article advocates dedicating traffic lanes to bus-rapid transit even though it admits that such “lanes come at a cost for drivers: a loss of parking, a loss of driving space, or both.” Increase congestion means cars will waste fuel and spew more greenhouse gases into the atmosphere sitting in traffic. Instead, the paper should be arguing for measures that will relieve congestion, not make it worse.
Los Angeles already has one dedicated bus-rapid transit line, the Orange Line, which currently runs at less than 6 percent of capacity — a maximum of 15 buses an hour when it could handle more than 250. In a typical boneheaded move, Metro is addressing this issue by preparing to spend up to $1.7 billion replacing buses with light rail, which will significantly reduce the capacity of the line.
Dedicated bus-rapid transit lines can move up to 30,000 people an hour in the same amount of space taken up by a light-rail line that can move, at most, 12,000 people an hour. But there are almost certainly no corridors in Los Angeles that generate enough transit riders to justify taking lanes away from general traffic and dedicating them to buses.
Transit buses often run nearly empty, and when in general traffic they frequently stop and then reenter traffic, often adding more to congestion than the few cars they take off the road. L.A. Metro buses carry an average of fewer than 16 passengers (that is, passenger miles divided by vehicle miles is less than 16). This is more than most, but since only some of those 16 passengers would otherwise be driving a car, those buses are probably adding too congestion. The solution is not dedicated lanes but smaller transit vehicles.
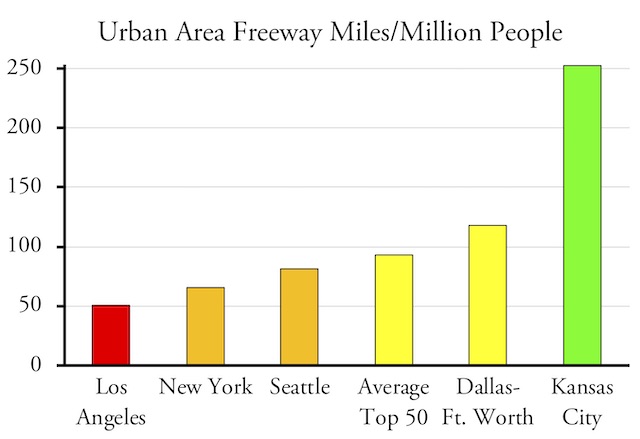
Beyond transit, Los Angeles could do much to relieve congestion. For one thing, it has the fewest miles of freeways per capita of any major urban area in the United States. In 2017, the Los Angeles urban area had less than 51 miles of freeway per million residents. Even New York had 66, and some urban areas had well over 100. The average for the nation’s 60 largest urban areas was 94.
Not coincidentally, Kansas City has some of the least congestion and fastest average driving speeds of any major city in the country. Freeway miles are from 2017 Highway Statistics table HM72, but that table shows 2010 population data, so I used 2017 population data from the American Community Survey, table B01003.
Even without adding new freeways, the state could significantly relieve congestion by improving existing freeways. Many of the existing highways have no auxiliary lanes for vehicles getting on and off the highways, thus adding to congestion as people are forced to slow down prior to exiting when still in a freeway lane and to immediately merge with traffic when entering a freeway. By cutting down on fuel wasted when sitting in traffic, congestion relieve could do far more to reduce greenhouse gas emissions than putting more buses on the road.
Is Increased Service the Answer?
A recent APTA review of transit trends indicated that some transit agencies are trying to respond to ridership declines. One way is by changing from a hub-and-spoke system to a grid route model. Another is to increase bus frequencies in high-use corridors. Others are attempting to incorporate “micro transit” into their systems, perhaps by contracting with Uber or Lyft, to get people the “first and last mile” to and from transit stops.
Such actions may result in short-term recoveries, but I doubt they will successfully reverse the long-run decline in transit ridership. For one thing, although declines in transit service clearly contributed to the decline in Los Angeles bus ridership, this doesn’t mean that increasing service can significantly increase ridership.
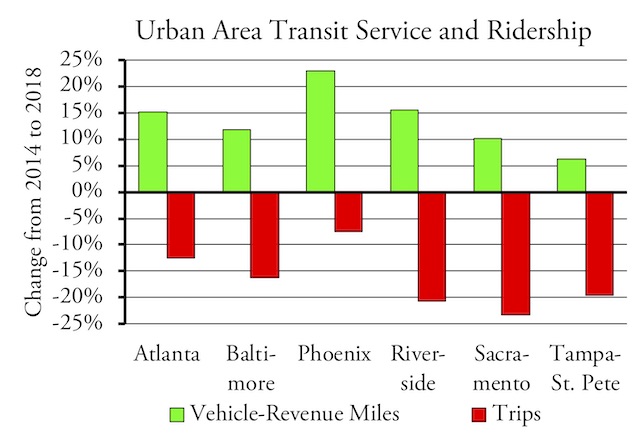
These urban areas saw some of the largest differences between changes in transit service and changes in ridership. Increased service is obviously not the silver bullet for transit recovery.
The latest monthly update to the National Transit Database reveals that transit service has significantly grown in many urban areas, yet ridership nonetheless declined (for annual totals, see my enhanced spreadsheet). Between 2014 and 2018, transit service grew yet ridership fell in two-thirds of the nation’s fifty largest urban areas, while service fell and ridership fell even more in all but five of the other urban areas. Some of the few in which ridership grew required massive increases in service to obtain that growth: for example, an 8.5 percent increase in service produced just 0.4 percent more riders in Denver. Everywhere, transit is seeing diminishing returns.
Bus vs. Rail
The Los Angeles Times article focused on bus ridership because Los Angeles bus ridership is declining while rail ridership is growing. But the main reason rail ridership is growing is because Metro has added two new light-rail lines in the past decade. This led to an increase in riders, but ridership per mile of track has declined, indicating that Metro gets diminishing returns for each new mile it builds. Heavy-rail ridership, meanwhile, has fallen nearly 15 percent in the past five years.
Some people still seem to think that building more rail is the solution to ridership declines. The American Public Transportation Association recently released first quarter 2019 ridership data showing that heavy rail and light rail are both losing as well when the first quarter of 2018 is compared with 2019.
Of the fifteen heavy-rail systems tracked by APTA, ridership declined in ten and grew in five, with an overall decline of 3.33 percent. Of 29 light-rail systems (including streetcars) tracked by APTA, ridership declined in 19 and grew in 10, with an overall decline of 2.37 percent.
Commuter rail did a little better, declining in 18 systems and growing in 12 with an overall gain of 2.07 percent. However, all of this gain can be attributed to 2.5-million ridership growth on New York’s Long Island Railroad.
Of the 36 bus systems that APTA considers to be the nation’s largest, 28 lost riders while 8 gained, for an overall decline of 0.96 percent. In all, rail lost 2.7 percent while bus (including trolley buses) only lost about 1.0 percent, indicating that rail is hurting at least as much if not more than buses.
A couple of years ago, transit consultant Jarrett Walker asked whether bus. vs. rail was even the right comparison to make. “It’s easy to analyse this ‘bus vs rail,'” he said, “because that’s how the National Transit Database is structured, but nobody knows if that’s the real distinction that matters.” Walker’s article posed some useful questions for further research.
However, I suspect that the real distinction that matters for transit is not the mode of travel but the purpose of travel. According to the latest National Household Travel Survey, the share of transit riders who are commuting to work grew from under 30 percent in 2009 to more than 37 percent in 2017. Due to a smaller sample size, these numbers are less reliable than, say, the American Community Survey, but other anecdotal evidence indicates that ride hailing is eating into transit’s non-commuting customer base but not so much into commuters. One reason why commuter rail seems to be doing better than other forms of transit is that it operates mainly during rush hours and therefore doesn’t feel the loss of non-commuter riders as much.
Transit’s Future
Transit agencies believe they are taking bold steps by following Jarrett Walker’s advice and converting hub-and-spoke to grid systems and emphasizing service in the corridors that generate the most riders. But it is going to take much more to keep transit viable in the next decade.
The first question to ask is why are we subsidizing transit? As I’ve previously shown in policy brief 6, low-income people are buying cars and abandoning transit while transit’s major growth market is among people who earn more than $75,000 a year. This argues against more transit subsidies.
Meanwhile, Los Angeles Metro is not alone in using more energy and emitting more greenhouse gases than the average car. Transit is more environmentally friendly than driving a car in just four major urban areas: New York, San Francisco, Portland, and Honolulu. We can do more to reduce emissions for less money by encouraging people to buy more fuel-efficient cars than by subsidizing transit.
The second policy to question is transit agencies’ love for big-box transit. Why do they need rail transit when buses can move more people per hour through a given corridor? Why do they need 100-passenger buses when they fill an average of just 25 seats? There may be a few corridors that can justify big buses (though none can justify low-capacity, high-cost light rail), but for the most part smaller, more nimble vehicles would make more sense.
These are existential questions that most transit agencies aren’t willing to face. Most of them already have taxes dedicated to their use, and they are just trying to justify keeping them despite declining ridership. These subsidies have led to cushy jobs: the CEOs or general managers of most of the nation’s largest transit agencies typically earn between $200,000 and $300,000 a year. The CEO of LA Metro, for example, is paid well over $300,000, or nearly twice as much as the governor of California. It is unlikely that these people are willing to consider the kinds of major changes that will be needed in transit’s future.
Thus, major changes will be up to elected officials, and the public in general will need to put pressure on those officials. Otherwise, transit’s future will be one of zombie agencies running nearly empty vehicles at huge taxpayer expense.



You wanna go green, Go Nuclear. Before Nuclear was only electricity, However now the potential for nuclear to do things before only done with fossil fuels. High temperature reactors, with temps pushing 600 degrees celsius you can do industrial heat applications without carbon dioxide……… split water into hydrogen and oxygen, two of the most valuable industrial gases in the world. You can take coal and thru fischer tropsch convert it to synthetic aviation fuel. One reason the Luftwaffe almost kicked our asses in WWII, they used synthetic fuels instead of refined petroleum and it had a 10% greater power density. Thats when we came up with ethyl fuel. We could turn coal from the filthiest fuel on the planet into sulfur free; and turn 50 dollar a ton junk into 1800 dollar per ton jet fuel and turn coal country into the aviation fuel capital of the nation. And the sulfur rather than go in the atmosphere; Sulfur has thousands of industrial uses.
Besides that coal ash that cement companies would kill for. Coal and coal ash is also a concentrated source of rare earths……..which hold key for extraction using heat without the ENORMOUS toxic waste profile of mining and processing them.
With the reactors waste heat, you can do some water desalination without the enormous electricity consumption. There in California aside from a little rain, you get almost no additional water regardless of weather reports, it’s a perpetual drought from here on out. Be nice to get some fresh water without pumping the aquifers as much anymore or better yet regenerating the aquifers by pumping new water into them.
From a economy standpoint you can start to use reactors for industrial heat output. 72% of the worlds energy is thermal based because it’s efficient to convert thermal energy into work without having to convert it to electricity. You convert to electricity you lose half to 2/3rds of the energy as waste heat; that’s why manufacturing gases is ridiculously inefficient using electric power other wise everyone would do it. If you can produce hydrogen in large quantities and nitrogen via cryogenic distilling (using heat as the sink source) you can economically produce Ammonia without the energy intensive Bosch process and manufacture fertilizer without substantial pollution. Hydrogen has numerous other industrial applications, metal making, polymer manufacture, chemical making. You can start light metal extraction from human waste (potassium, Sodium, Phosphates). You can manufacture methanol from CO2 and hydrogen and replace or substitute automotive fuels.
All in all, and here’s where your public policies start to come in; you’re talking about disrupting a 72 TRILLION dollar supply chain market that was heavily dependent on fossil fuels to power most of these industries. Once you can start to not only decarbonize but de-politicize your economy and means of production you can do some amazing things in the geo-poltical spectrum. You have countries where 80-95+ percent of their income, GDP come from petroleum and petroleum distillates; beyond simply meeting those industrial needs mentioned above, not to mention their domestic energy use. Beside the fact they’re not particularly Western world friendly; Some, they’re sponsors of terrorism the world over; Petroleum and petro dollars constitute the bulk of their political power…..And some strange things are gonna start to happen to those societies when their not needed anymore.
A very good post. A critique of using freeway miles is that it really should be lane miles. Is the Antiplanner using freeway miles when it is actually lane miles?
The new Toyota hybrid AWD RAV4 costs only $800 more than the standard version and gets 39 miles per gallon. If is is reliable as the Prius has been then vehicles like this can be driven for hundreds of thousands of miles at a very low cost and CO2 emission. Thus Uber like service with vehicles like this with multiple passengers may be far more fuel efficient than current buses and trains.
Paul: I used freeway miles, not lane miles. There are arguments for both: more freeway miles mean more people are close to a freeway. When calculating lane miles per capita, Los Angeles is still well below average (447 vs. 559), but not the lowest: New York is 392, Kansas City is 1,313.
“Not coincidentally, Kansas City has some of the least congestion and fastest average driving speeds of any major city in the country.”
Another reason to love KC.