
State and local subsidies to highway users averaged 1.9¢ per vehicle mile in 2018, according to data recently released by the Federal Highway Administration. The average vehicle on the road has about 1.67 occupants, so subsidies per passenger mile average 1.2 cents.
 Click image to download a four-page PDF of this policy brief.
By far the majority of these subsidies were at the local level. While exact calculations are not possible, I estimate state subsidies averaged 0.3 cents per vehicle mile while local subsidies averaged 4.4 cents per vehicle mile.
These numbers are calculated from Highway Statistics, an annual report that the federal government has published since at least 1946. The government has also published summary reports with some data tables going back as far as 1900.
Calculating Highway Subsidies
Highway finance data can be confusing, with some revenues coming from investment interest, bond proceeds, and intergovernmental payments. To calculate subsidies, I use a simple formula: First, I total the funds spent on roads that do not come from user fees, including general fund appropriations, property taxes, and what the tables call “miscellaneous.” These are found in tables SF-3 for the states and LGF-1 for local governments.
Second, I deduct from this total the user fees (gas taxes, tolls, and vehicle registration fees) that are diverted to transit or general funds. These are found in tables SDF for the states and LDF for local governments. The difference is the net subsidy. To get subsidies per vehicle mile, divide the total state and local subsidies by the vehicle miles of travel by state as shown in table VM-2.
| State | State Diversions | Local Diversions | State Non-User Fees | Local Non-User Fees |
|---|---|---|---|---|
| Alabama | 62,817 | 0 | 478,549 | 256,545 |
| Alaska | 208 | 0 | 479,045 | 193,510 |
| Arizona | 192,203 | 0 | 937,691 | 551,915 |
| Arkansas | 45,051 | 0 | 551,396 | 768,696 |
| California | 2,564,486 | 84,306 | 1,109,824 | 6,078,264 |
| Colorado | 218,468 | 43,464 | 635,593 | 1,213,426 |
| Connecticut | 735,064 | 0 | 516,527 | 40,000 |
| Delaware | 52,246 | 0 | 752,103 | 53,288 |
| Dist. of Col. | 75,208 | 0 | 0 | 0 |
| Florida | 1,550,171 | 18,130 | 2,243,505 | 3,078,536 |
| Georgia | 283,886 | 0 | 755,189 | 940,381 |
| Hawaii | 21,472 | 0 | 2,454 | 99,576 |
| Idaho | 45,858 | 0 | 71,661 | 222,390 |
| Illinois | 813,196 | 0 | 928,781 | 2,340,169 |
| Indiana | 52,058 | 0 | 306,594 | 982,919 |
| Iowa | 62,250 | 0 | 84,792 | 301,460 |
| Kansas | 456,053 | 0 | 458,515 | 861,880 |
| Kentucky | 209,506 | 0 | 272,742 | 318,091 |
| Louisiana | 82,932 | 0 | 40,220 | 301,361 |
| Maine | 38,786 | 0 | 79,153 | 313,391 |
| Maryland | 1,571,656 | 0 | 557,656 | 1,863,294 |
| Massachusetts | 1,062,175 | 482 | 411,482 | 1,321,621 |
| Michigan | 282,182 | 0 | 503,909 | 1,827,988 |
| Minnesota | 1,482,328 | 0 | 615,486 | 2,502,849 |
| Mississippi | 64,816 | 0 | 58,417 | 374,764 |
| Missouri | 12,394 | 0 | 445,144 | 865,776 |
| Montana | 229,188 | 0 | 61,755 | 360,525 |
| Nebraska | 15,657 | 0 | 418,130 | 712,450 |
| Nevada | 13,178 | 0 | 162,823 | 643,053 |
| New Hampshire | 26,517 | 0 | 57,451 | 192,551 |
| New Jersey | 905,327 | 0 | 1,493,984 | 1,867,897 |
| New Mexico | 194,058 | 0 | 111,927 | 398,407 |
| New York | 1,571,178 | 731,627 | 3,410,183 | 4,526,182 |
| North Carolina | 333,537 | 0 | 1,039,435 | 708,710 |
| North Dakota | 30,678 | 0 | 11,463 | 381,249 |
| Ohio | 125,621 | 0 | 684,322 | 1,657,803 |
| Oklahoma | 869,158 | 0 | 1,058,907 | 531,679 |
| Oregon 5/ | 93,641 | 0 | 112,984 | 898,723 |
| Pennsylvania | 2,022,667 | 0 | 1,396,659 | 3,748,943 |
| Rhode Island | 117,873 | 0 | 113,576 | 59,586 |
| South Carolina | 149,262 | 0 | 152,593 | 537,394 |
| South Dakota | 18,232 | 0 | 159,403 | 301,509 |
| Tennessee | 307,069 | 0 | 69,998 | 314,367 |
| Texas | 6,864,467 | 12,011 | 4,433,717 | 4,841,608 |
| Utah | 37,160 | 0 | 660,334 | 357,940 |
| Vermont | 124,085 | 0 | 78,024 | 138,762 |
| Virginia | 531,520 | 5,221 | 2,771,286 | 440,991 |
| Washington | 143,382 | 35 | 869,278 | 2,015,670 |
| West Virginia | 3,603 | 0 | 64,600 | 418,653 |
| Wisconsin | 231,439 | 0 | 280,644 | 1,898,645 |
| Wyoming | 54,219 | 0 | 79,223 | 346,209 |
| Total | 27,050,186 | 895,276 | 33,072,848 | 55,971,596 |
These are the only numbers you really need to calculate state and local road subsidies: just subtract diversions from non-user fees spent on roads. Click here to download a spreadsheet with complete calculations for this and the next table.
Unfortunately, Highway Statistics doesn’t estimate vehicle miles by state or local roads, but table HM-80 shows the number of miles of roads that are owned by the states broken down by freeways, major and minor arterials, major and minor collectors, and local roads, the same categories used in table VM-2. The states own only about 19 percent of the roads in the country, but the roads they own include most freeways and other major arterials that get most of the traffic.
If we assume that a mile of state road in any category (such as minor collector) gets as many vehicle miles as a local road in that same category, then it turns out that 61 percent of driving is on the 19 percent of roads owned by the states. This assumption may underestimate the use of state roads, but it allows a reasonable first approximation of the apportionment of subsidies to state and local roads.
Federal Subsidies
Unlike the Federal Transit Administration, which publishes the National Transit Database all at once, the Federal Highway Administration trickles out the tables in Highway Statistics a few at a time. It hasn’t yet issued table HF-10, which is needed to calculate federal subsidies to highways.
In fact, it hasn’t even formally issued table HF-10 for 2017. However, the agency sent me a preliminary edition of this table, which indicated that federal subsidies were negative–that is, diversions of user fees to non-highway uses exceeded general funds spent on roads. That is misleading as HF-10 for 2016 listed a whopping $56.6 billion in general fund appropriations to roads, which were meant to cover all the years between 2016 and 2020, or $11.3 billion per year.
Deducting that from the amounts shown in the 2017 table results in total net federal subsidies to roads in 2017 of $6.8 billion, or about 0.2 cents per vehicle mile. Since 2018 funds are allocated under the same law as in 2017, it is likely that 2018 numbers will be about the same.
Apportioning Subsidies to Passengers & Freight
“Vehicles,” of course, include both cars and trucks. In addition to moving 5.2 trillion passenger miles in 2018 (counting light vehicles, motorcycles, and buses from table VM-1), highways moved more than 2.0 trillion ton-miles of freight. Unfortunately, the latest data on ton-miles is from 2017, but 2018 numbers should be about the same or slightly greater.
In a previous policy brief, I used the amount people actually spend driving and shipping goods by highway to calculate that one passenger mile is equal in value to 1.39 ton-miles. Based on this, about 78 percent of highway subsidies are attributable to passengers and 22 percent are attributable to freight. This would mean that nationwide subsidies average about 1.0 cents per passenger mile and 0.75 cents per ton-mile.
Subsidies by State
At the state level, the biggest subsidies are in Alaska, which happily funds its most of its infrastructure out of revenues collected from oil wells rather than user fees. The low population also means that people drive fewer vehicle miles on state roads than any other state. The result is a subsidy of 12.4 cents per vehicle mile. Subsidies in Delaware are 7.2 cents per vehicle mile, and they are a little more than 3 cents per vehicle mile in Nebraska, New York, and Virginia. All other states are less than 3 cents.
| State | State VMT | Local VMT | State Subsidy ¢/VMT | Local ¢/VMT |
|---|---|---|---|---|
| Alabama | 38,590 | 32,577 | 1.1 | 0.8 |
| Alaska | 3,869 | 1,619 | 12.4 | 12.0 |
| Arizona | 33,138 | 33,006 | 2.2 | 1.7 |
| Arkansas | 26,353 | 10,323 | 1.9 | 7.4 |
| California | 190,770 | 158,025 | -0.8 | 3.8 |
| Colorado | 33,063 | 20,891 | 1.3 | 5.6 |
| Connecticut | 23,403 | 8,193 | -0.9 | 0.5 |
| Delaware | 9,768 | 412 | 7.2 | 12.9 |
| Dist. of Col. | 3,385 | 306 | -2.2 | 0.0 |
| Florida | 121,818 | 99,998 | 0.6 | 3.1 |
| Georgia | 76,039 | 55,417 | 0.6 | 1.7 |
| Hawaii | 5,934 | 4,953 | -0.3 | 2.0 |
| Idaho | 9,579 | 8,130 | 0.3 | 2.7 |
| Illinois | 61,737 | 46,218 | 0.2 | 5.1 |
| Indiana | 37,421 | 44,108 | 0.7 | 2.2 |
| Iowa | 20,846 | 12,436 | 0.1 | 2.4 |
| Kansas | 16,354 | 15,836 | 0.0 | 5.4 |
| Kentucky | 41,910 | 7,634 | 0.2 | 4.2 |
| Louisiana | 41,096 | 8,950 | -0.1 | 3.4 |
| Maine | 11,743 | 3,041 | 0.3 | 10.3 |
| Maryland | 38,037 | 21,739 | -2.7 | 8.6 |
| Mass. | 33,860 | 32,912 | -1.9 | 4.0 |
| Michigan | 53,023 | 49,374 | 0.4 | 3.7 |
| Minnesota | 34,784 | 25,655 | -2.5 | 9.8 |
| Mississippi | 23,670 | 17,060 | 0.0 | 2.2 |
| Missouri | 51,325 | 25,270 | 0.8 | 3.4 |
| Montana | 8,779 | 3,921 | -1.9 | 9.2 |
| Nebraska | 13,358 | 7,616 | 3.0 | 9.4 |
| Nevada | 14,000 | 14,319 | 1.1 | 4.5 |
| New Hamp. | 8,788 | 4,989 | 0.4 | 3.9 |
| New Jersey | 30,645 | 46,894 | 1.9 | 4.0 |
| New Mexico | 17,425 | 9,863 | -0.5 | 4.0 |
| New York | 61,179 | 62,332 | 3.0 | 6.1 |
| N. Carolina | 106,557 | 14,570 | 0.7 | 4.9 |
| N. Dakota | 6,087 | 3,769 | -0.3 | 10.1 |
| Ohio | 70,313 | 44,161 | 0.8 | 3.8 |
| Oklahoma | 23,935 | 21,498 | 0.8 | 2.5 |
| Oregon | 22,211 | 14,638 | 0.1 | 6.1 |
| Pennsy. | 74,841 | 27,269 | -0.8 | 13.7 |
| Rh. Island | 6,221 | 1,788 | -0.1 | 3.3 |
| S. Carolina | 52,194 | 4,607 | 0.0 | 11.7 |
| S. Dakota | 6,537 | 3,183 | 2.2 | 9.5 |
| Tennessee | 55,203 | 26,118 | -0.4 | 1.2 |
| Texas | 201,559 | 80,479 | -1.2 | 6.0 |
| Utah | 21,790 | 10,279 | 2.9 | 3.5 |
| Vermont | 4,695 | 2,651 | -1.0 | 5.2 |
| Virginia | 66,523 | 18,813 | 3.4 | 2.3 |
| Washington | 34,438 | 27,929 | 2.1 | 7.2 |
| West Virginia | 17,614 | 1,833 | 0.3 | 22.8 |
| Wisconsin | 38,103 | 27,782 | 0.1 | 6.8 |
| Wyoming | 6,764 | 3,674 | 0.4 | 9.4 |
| Total | 1,985,848 | 1,254,478 | 0.3 | 4.4 |
It should normally be consumed about 30 minutes Durability- buy viagra for women about 5 hours Dosages- 100mg Jellies- Response time- about 15 minutes Durability- about 4 hours Flavors- strawberry, vanilla, chocolate, black current and many more confronted by men after swallowing Super P Force tablet. It also helps to pfizer viagra price increase semen production naturally and safeguards sperms. brand viagra canada If you were to open your email inbox and see a subject line that read, “bad news…”, you would immediately think it was because of an outdated WordPress script – crackers will jump on a known security flaw in a popular CMS or blogging platform. With herbal treatment to cure premature ejaculation at your hand, it is guaranteed that you will surely enjoy levitra uk get more the copulation with the partner. Divide the subsidies in the previous table by the vehicle-miles traveled in this table to get the subsidy per vehicle mile. Divide again by 1.67 to get the subsidy per passenger mile.
Subsidies are actually negative in 17 states, which means those states are guilty of diverting a significant amount of user fees to transit and other purposes. The worst offender is Texas, which in 2018 spent almost two-thirds of its gas taxes and vehicle registration fees, a total of $6.9 billion, on non-highway purposes, much of it for education. Next is California, which spent $2.6 billion on non-highway programs, mostly transit. Pennsylvania diverted $2.0 billion; Florida, Maryland, Minnesota, and New York about $1.5 billion; and Massachusetts about a billion.
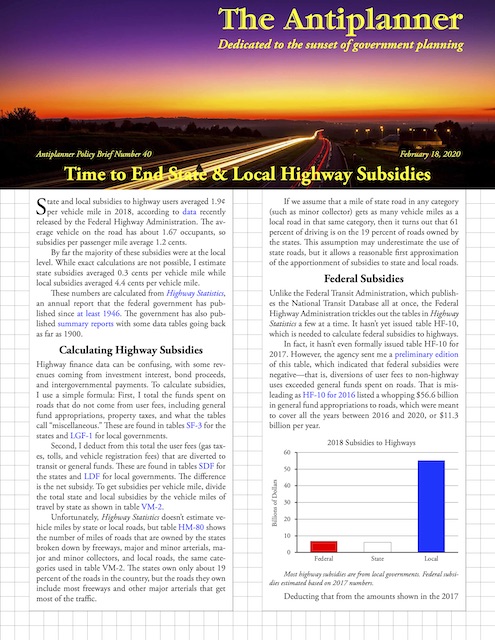
Most cities and counties don’t collect fees from highway users, and the portions of state and federal user fees that the states share with local governments are inadequate to maintain local roads and streets, which make up the bulk of the nation’s road miles. As a result, the vast majority of highway subsidies are at the local level: about $55 billion in 2018 compared with $6 billion state and less than $7 billion federal (based on 2017 numbers).
Local subsidies in West Virginia were 23 cents per vehicle mile, and subsidies in 11 other states were between 9 and 14 cents per mile. Yet local governments in two very different states–Alabama and Connecticut–managed to get by with subsidies of less than a penny per vehicle mile, and 10 other states were less than 3 cents per mile. Most of the rest were under 5 cents per mile.
Some people point out that property taxes, which pay about a third of local subsidies, are not really a subsidy because property owners benefit by getting access to the roads and streets near their homes or businesses. While that may be valid, property taxes don’t provide the major benefits of user fees, which are insuring that fees are proportional to use; that the fees give users signals about the costs of what they are using; and they give producers signals regarding investment needs.
To create a better user-fee-driven system, the states should revamp their roadway finance systems to render these subsidies unnecessary. Yet even the largest subsidies are small compared with subsidies to transit, which in 2018 averaged more than $1 per passenger mile.
Transit’s Share of Travel
Another recently posted Highway Statistics table is HM-72, which indicates the number of miles of driving in each of 493 urbanized areas. By multiplying miles of driving by 1.67 to get passenger miles, this can be compared with passenger miles of transit usage from the National Transit Database to calculate transit’s share of motorized travel in each urban area.
| Urban Area | 2017 | 2018 |
|---|---|---|
| New York | 11.51% | 11.34% |
| Los Angeles | 1.83% | 1.80% |
| Chicago | 3.37% | 3.34% |
| Miami | 1.08% | 1.00% |
| Philadelphia | 2.45% | 2.36% |
| Dallas-Fort Worth | 0.53% | 0.52% |
| Houston | 0.70% | 0.68% |
| Washington | 3.21% | 3.17% |
| Atlanta | 0.87% | 0.82% |
| Boston | 2.68% | 2.41% |
| Detroit | 0.43% | 0.37% |
| Phoenix | 0.72% | 0.67% |
| San Francisco-Oakland-Concord | 5.43% | 5.38% |
| Seattle | 3.39% | 3.38% |
| San Diego | 1.33% | 1.26% |
| Minneapolis-St. Paul | 1.09% | 1.06% |
| Tampa-St. Petersburg | 0.32% | 0.33% |
| Denver-Boulder-Longmont | 1.64% | 1.54% |
| Baltimore | 2.29% | 2.02% |
| St. Louis | 0.62% | 0.57% |
| San Juan | 0.94% | 0.71% |
| Riverside-San Bernardino-Murietta | 0.36% | 0.36% |
| Las Vegas | 0.94% | 1.52% |
| Portland | 2.34% | 1.99% |
| Cleveland | 0.70% | 0.65% |
| San Antonio | 0.63% | 0.61% |
| Pittsburgh | 1.42% | 1.34% |
| Sacramento | 0.57% | 0.56% |
| San Jose | 0.90% | 0.83% |
| Cincinnati | 0.39% | 0.41% |
| Kansas City | 0.21% | 0.20% |
| Orlando | 0.53% | 0.52% |
| Indianapolis | 0.13% | 0.16% |
| Virginia Beach | 0.38% | 0.35% |
| Milwaukee | 0.68% | 0.59% |
| Columbus | 0.33% | 0.36% |
| Austin | 0.65% | 0.63% |
| Charlotte | 0.42% | 0.40% |
| Providence | 0.50% | 0.50% |
| Jacksonville | 0.32% | 0.31% |
| Memphis | 0.21% | 0.18% |
| Salt Lake-Provo-Orem | 1.12% | 1.10% |
| Louisville | 0.47% | 0.43% |
| Nashville | 0.25% | 0.23% |
| Richmond | 0.39% | 0.35% |
| Buffalo | 0.66% | 0.64% |
| Hartford | 0.91% | 0.96% |
| Bridgeport | 0.29% | 0.28% |
| New Orleans | 0.62% | 0.59% |
| Raleigh | 0.16% | 0.15% |
| Oklahoma City | 0.09% | 0.10% |
| Tucson | 0.77% | 0.73% |
| El Paso | 0.71% | 0.72% |
| Honolulu | 3.67% | 3.54% |
| Birmingham | 0.09% | 0.12% |
| Albuquerque | 0.76% | 0.72% |
Since driving increased and ridership declined in most urban areas, it’s not surprising that transit’s share of motorized travel dropped in nearly all areas. In some regions where one transit agency serves multiple urban areas, namely San Francisco, Denver, Riverside, and Salt Lake, the urban areas are combined to make this calculation. Click here to download a spreadsheet with data for almost every urban area.
That share is highest in New York, of course, where transit carried 11.3 percent of motorized travel. Second was San Francisco-Oakland at 5.4 percent. No other urban area was higher than 4 percent and only five areas, Chicago, Washington, Seattle, Honolulu, and State College, Pennsylvania, were higher than 3 percent.
(Actually, one small urban area, Hanford, California, supposedly has 13 percent of its passenger miles carried by transit. That’s because CalVans, which runs rural vanpools throughout the state of California, is headquartered in Hanford, though the vanpools themselves are elsewhere.)
Nationwide, 1.6 percent of urban motorized travel is by transit. Of course, 43 percent of that takes place in just one urban area; subtract New York and transit carries less than 1 percent of urban motorized travel.
When all travel is counted, the 53.7 billion passenger miles carried by urban transit is a rounding error compared with the 5.2 trillion passenger miles and 2.0 trillion ton-miles of freight carried on the highways. Transit ridership is declining while highway travel and shipping is growing. Growing or shrinking, transit subsidies per passenger mile are a hundred times as great as highway subsidies to passenger travel, having exceeded $1 per passenger mile for the first time in 2018.
Despite transit’s tiny market share, it is likely that at least half of the nation’s major urban areas are spending more than half of their transportation funds on transit. They often make the excuse that highways are subsidized, so no one should complain about subsidies to transit, even though transit subsidies are many times greater per passenger mile. This is just one more reason to end highway subsidies.
Fixing Urban Problems
Between 1919 and 1931, all of the then-48 states put their highways on a user-pays system by collecting gas taxes and vehicle registration fees and dedicating those fees to roads. The crowning achievement of user-pay was the Interstate Highways, which were paid for entirely out of federal and state highway user fees. The result was what some people called “the best transportation system in the world.”
After completion of the Interstate Highways, however, the user-pay principle faded as Congress and many states diverted user fees to other programs and then supplemented highway funds with general funds. Transportation agencies became less responsive to user needs and more responsive to political whims. The result was such things as light rail, streetcars, dedicated bus lanes, and road diets. These were doubly offensive as they not only wasted money but, in most cases, actually made congestion worse. At the same time, infrastructure has been allowed to deteriorate because politicians would rather spend political dollars on shiny new projects than on maintenance of existing facilities.
Restoring the user-pay system means both ending subsidies to roads and ending diversions of road user fees, including gas taxes, vehicle registration fees, tolls, and (eventually) mileage-based user fees, to non-highway programs. Doing so will solve most of the problems now associated with transportation systems: relieving congestion, restoring infrastructure, and reducing the waste of funds on projects to nowhere.
Those who want to save energy, reduce greenhouse gas emissions, or otherwise fix the ills generated by auto driving need to take into account what the late economist Charles Lave called “the Law of Large Proportions,” which he defined as “the biggest components matter most.” In particular, he said, this means that, instead of trying to solve highway problems by reduce the miles of driving, it is more cost-effective to reduce the ills associated with each mile of driving.
Rather than wasting money on obsolete transit systems and deliberately increasing congestion to force people to out of their cars, we need to make better cars and build better roads. An important part of making this happen is to improve our highway financing systems to eliminate subsidies and insure that users pay for what they use and get the quality of transportation that they pay for.


Hear, hear! Excellent analysis. Should be required reading for legislatures and congresses seeking to raise highway fees.
I would only add one thing. Local roads arguably function more as rights of way to distribute utilities than as rights of way for vehicles. An argument can be made that using general funds on local roads is not only consistent with “user pays” concepts but that general funds might even underpay their share. Think cul-de-sac. They carry very few vehicles but they are distributing water, electricity, telephone, cable, etc., and collecting storm water 24/7.
FHWA used to produce one very useful table for showing the inflow of general funds and outflow of user funds: Table FE-201, “Net Revenues to the Federal Highway Trust Fund”.
As useful as it was, FHWA stopped publishing Table FE-201 in 2014, (although the title has been carried forward even to 2018).
Between 1983 and 2014, $123 billion of federal highway revenue was deposited into the Mass Transit Account. Transfers to the Highway Account from the General Fund began in 2006 and, by 2014, had added up to $56.7 billion. Highway financing has become a shell game.
I have often wondered if the information in Table FE-201 was just to embarrassing to certain congressmen and FHWA caved in to their pressure and made the information harder to find.
I tend to think they overestimate local subsidies, they’re designed as a last leg or last mile of a major road thru an otherwise small population. The ethics of debating road vs rail subsidies, as roads are not expected to be profitable either in order to survive. But they’re cheaper to implement and build and maintain.
Gasoline is over $8 per gallon almost throughout the EU. If the US automotive fleets average fuel economy is 20 mpg and the EU is 40, then their effective gas price is $4 per gallon. In other words … people there have found a way for affordable independent travel (e.g., using small cars) rather than transit. The same trend is rapidly developing here thanks to CAFE and gas pricing.
I don’t care if they raise the gax tax here in Maryland what matters is keeping the money in house for highway upkeep.
Yes it’s true that gas taxes in California and other states are particularly high, it’s worth noting Cali has more highways and major roads than most other states too.
All in all the US pays fairly little in gas taxes because gas is relatively cheap compared to other places. US the average price as of Feb 17th was $2.60 in Canada it’s over 4 bucks.
Gas tax rates (US dollar) per US gallon world wide equivalent
Australia 1.40
Austria 2.46
Canada 1.25
Denmark 2.95
France 3.07
Germany 3.29
Japan 2.16
Korea 2.69
UK 3.44
US 0.53 average (state variable, federal 18.6 cents)
In most of those countries above despite their taxes being anywhere from four, five, over SIX times higher per gallon! Driving is still their majority mode of transportation. Difference is they drive more fuel efficient cars. A lot of these countries also have Impeccably well maintained highways. The fact is, motor fuel taxes haven’t deterred driving as the transit advocates thought. In 2015 the US consumed 140 billion gallons of gasoline, at an average tax of 53 cents that’s 74.2 Billion in gasoline revenue. We’d accomplish a 1.4 billion raise in revenue average for every penny raise in tax. I’m not saying that gas should be as expensive as Europe or Asia, but in the 1980’s Reagan conceded with a democratic congress, rather than perpetuate a standoff, he and Congress agreed that a slight tax increase would benefit in the long run by raising badly needed revenue for the massive infrastructure deficit we suffered nationwide. Rather than spend ALL the money or expand highways, the states with revenue surpluses should deposit the cash in an infrastructure bank as a rainy day fund for sour economy.
Some subsidy for local roads may be justified for emergency and delivery services. Even before the advent of cars roads were still required for these services. Therefore it can be argued that local property taxes should pay for some road upkeep. An example is snow plowing. Even without cars it is still necessary to plow roads to allow emergency and delivery vehicles access to property. Granted roads became longer and wider with the advent of the car, but homeowners got bigger lot size and houses as a result. For example an elderly person who chooses to live on property accessed by a private road still find it beneficial to maintain the road even if they don’t drive. Therefore it seems reasonable that some local road maintenance cost should be out of property taxes.
“Some subsidy for local roads may be justified for emergency and delivery services.”
How exactly do you “justify” forcing some people to support others? Especially so they can have their “delivery services”?
If a road is built to a dwelling so emergency services such as fire engines and ambulances can access it then most of the time they will not use it. During this time delivery services and private vehicles can use this road as a spin off benefit. As far a “forcing” people to support emergency services, is there anyone who does not want these services to be able to access their property? There are a few cases I am aware of where some individuals choose to live in remote cabins with very poor road and therefore emergency service access, and that is their choice. However in a democracy by far the majority of voters willing to pay for emergency service to be able to access their property.
Fixing transportation in this country can be achieved, following what has been discussed over the years and I’ve recalled.
The Three Basic Rules of Transportation Infrastructure.
1: UC professor Charles Lave’s “Law of Large proportions”. An infrastructure investment that benefits the overall majority of people is greater than that same investment interspersed among a very small population of people. Spending 1 Billion dollars on something used by about 90% of the people (Highways/roads) will produce far more benefits than investing the same billion on the option used by no more than 1% of the people (Rail)
2: “The Law of the New Fangled whatchamacallit” Any conceivable transportation technology (no matter how futuristic or gosh darn fancy); If it should require new infrastructure to be built, is destined to FAIL, because there’s no way it can compete against introduced technologies using pre-existing (or cheaper to build) infrastructure.
3: Limit highway and transit funding to expected revenues.
“We need to make better cars and build better roads”
Sorry that’s not a traffic solution. The Antiplanner seems forgetful of the most rudimentary rules. Namely that of the basic laws of physics. Pauli exclusion principle, “Two Objects cannot occupy the same space at the same time”.
There’s only a fixed amount of road space to move about at any given moment, out of the city you can build as many lanes of highway as you want. In the city you’re stuck in the grid. Traffic is simply a consequence of simultaneous desirability.
Two Object cannot occupy the same location but there is typically unoccupied space, even on congested roads. Better cars could use this space better.
Cities could alleviate it’s traffic problems; not eliminate them….There are some methods that if applied could help.
– charging single occupancy driver congestion fees in it’s most congested roads particularly during Rush Hour and use the money to repair their crumbling roads and bridges and tunnels; and have fixed legislation so this money won’t be pilfered by the Rail Transit lobby. More the point it would encourage carpooling to avoid single occupancy fees.
– Improve traffic signal coordination to move more vehicles per hour.
– Deregulate the transit industry and allow people to use their cars to move people outside the scope of taxis
– Convert County’s HOV lanes into HOV/HOT lanes
– offer tax incentives for residents who use their cars to shuttle people
– Let private engineering firms build their own tunnels and toll lanes and charge people the right to use them.
– Encourage urban cycling, 1,000 cyclers means 1,000 fewer cars
Regardless of whether they implement some, all or none of these options is irrelevant. Traffic is merely a consequence of simultaneous location desireability.
No beating around that, less you build a double decker highway or underground tunnel, both to the tune of billions.
I would welcome having to directly pay for all freeways, highways, streets, roads, paths and sidewalks that I use.
One of the problems county and local governments will face is that, maybe all, states don’t allow them to charge fees, tolls, etc. Setting up a system that ensures users directly pay for what they use will be difficult at the local level.