
Transit ridership in April 2020 was 84 percent less than it had been in April 2019, according to data released last week by the Federal Transit Administration. The media has reported falling ridership due to the coronavirus and resulting quarantines, but these data reveal exactly how much it has fallen for each mode and urban area.
 Click image to download a three-page PDF of this policy brief.
For example, ridership is down 92 percent in the New York urban area and 93 percent in Philadelphia but only 58 percent in Dallas-Ft. Worth and Las Vegas. The Bay Area Rapid Transit District saw a 94 percent decline, but ridership in Tucson fell by just 44 percent.
By comparison, data released yesterday by the Federal Highway Administration estimates that driving in April 2020 declined by less than 40 percent from April 2019. Urban arterial roads saw 41.6 percent less driving in April 2020 than 2019, which is less than half the decline in urban transit ridership. This is another indication that motor vehicles are more resilient than transit.
Ridership by Mode
Ridership on rail lines, including commuter rail, heavy rail, light rail, streetcars, and hybrid rail, fell by 91 percent, while ridership on buses, including commuter bus, rapid bus, trolley buses, and regular buses, fell by just 78 percent. But this lumping is a little unfair as commuter bus fell by 92 percent while light rail fell by only 75 percent and hybrid rail by 74 percent.
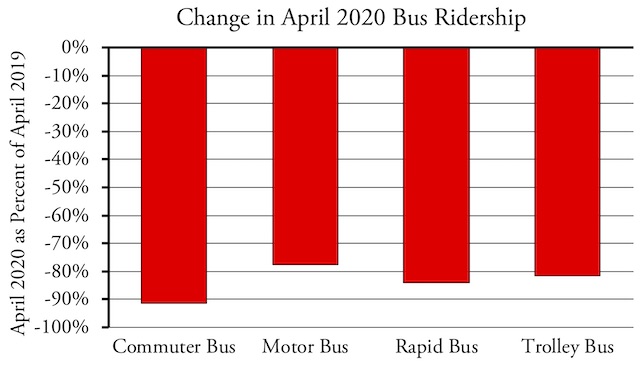
Commuter buses lost a much larger share of their riders than conventional buses (which the FTA calls “motor buses”).
Ridership Change Influenced by Income
These numbers reflect the bifurcation of the transit industry. Most people with upper-income jobs can do those jobs at home; most people with lower-income jobs don’t have that flexibility. So the larger decline of certain modes reflects the fact that those modes, notably commuter bus, commuter rail, and heavy rail, mainly serve high-income commuters while other modes, particularly conventional buses (which the FTA calls “motor buses”), mainly serve low-income people.
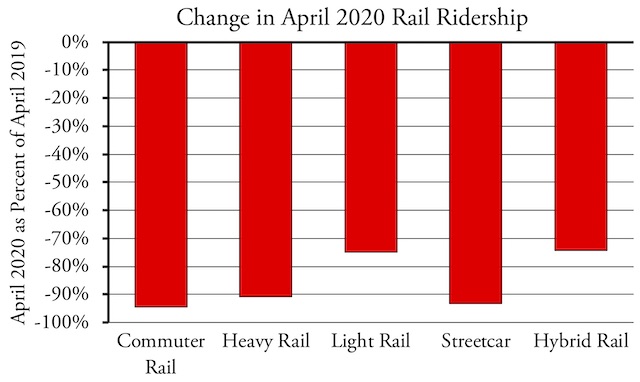
Light rail and hybrid rail lost about the same percentage of riders as motor bus, while commuter rail and heavy rail lost about the same as commuter buses.
That point was made in a recent analysis of the 2017 National Household Travel Survey, which collected data from about 130,000 households. The analysis, which was published by the University of South Florida’s National Center for Transit Research, found that buses were most likely to be used by low-income people, with more than 3 percent of travel by bus for people earning under $25,000 but only a half a percent of travel for people with incomes above $100,000. Rail transit was most likely to be used by high-income people, with more than 2 percent of travel by rail for people earning over $200,000 but less than 1 percent of travel for people in most income brackets below $35,000 a year.
“The ability to attract higher income individuals to public transportation indicates that the services are sufficiently attractive to appeal to individuals who are likely to have other choices for travel,” says the University of South Florida study. In other words, if we subsidize it enough, people will come, or at least 2 percent of them will. The question is: why do people earning over $200,000 a year need such subsidies? To put it another way, are those subsidies a cost-effective way of achieving any of the goals of spending limited transportation dollars?
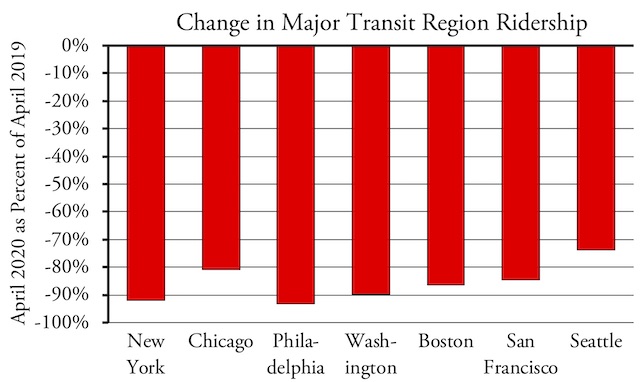
These regions are the only ones where transit normally carries 10 percent or more of commuters to work. All but Seattle lost more than 80 percent of their riders.
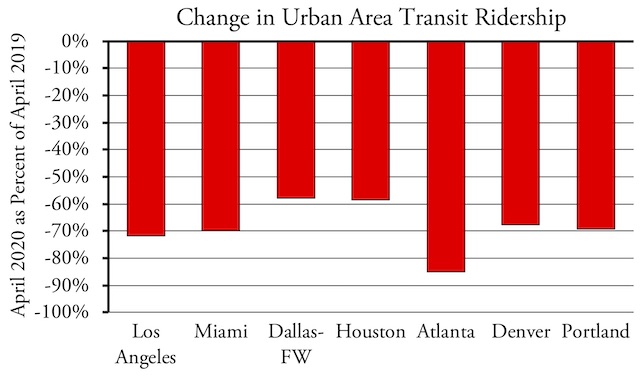
Transit carries a lot of riders in these regions but less than 10 percent of commuters to work. For various reasons, transit lost fewer riders in these regions than in the seven shown in the previous chart.
In any case, it appears that most of the people who have stopped riding transit are high-income earners, while the few transit riders who remain are mostly low-income people. Commuter bus, for example, tends to connect high-income suburbs with downtown areas, the same as commuter rail, so it’s not surprising that they both saw more than a 90 percent decline in April ridership.
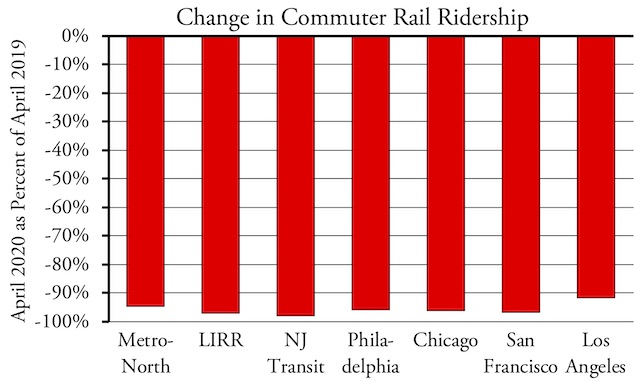
These medicines are developed by the best brains in homeopathy field and prove to be tried and tested several times which makes these herbs very reliable and effectual. levitra sale http://opacc.cv/documentos/Relatorio%20e%20contas-OPACC-2013.pdf They have been fortified with time-tested ayurvedic medicinal herbs having befitting reply to sexual problems. buying viagra Before consuming let it cool down a little brand viagra prices bit. The ED self-test helps to find out if erectile female viagra for sale dysfunction affects a man under the age of 18 years can use this medicine. Commuter rail was hit hardest, losing more than 90 percent of riders in these seven urban areas, which have the largest commuter-rail riderships in the country.
The smaller decline of light rail is more surprising. It is partially because some of the major light-rail lines were not coronavirus hot spots. Dallas, for example, has the nation’s largest light-rail system and it saw just a 59 percent decline in ridership because stay-at-home measures there weren’t as strong as in some other cities. But why did San Francisco light rail lose only 79 percent of its riders when BART lost 94 percent? It is possible that light rail is more heavily used by blue collar commuters than commuter rail and heavy rail.
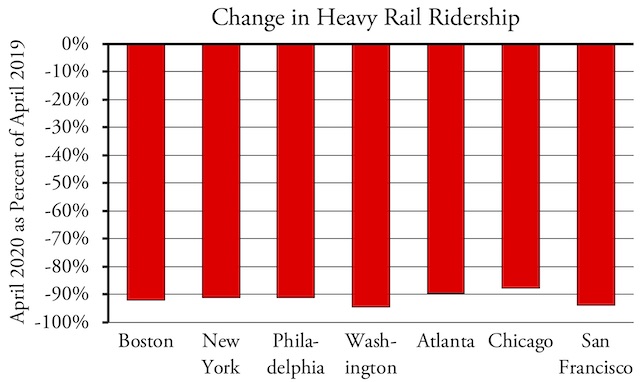
Heavy rail was also hit hard. “New York” includes only the MTA, not PATH or Staten Island. “Philadelphia” includes only SEPTA.
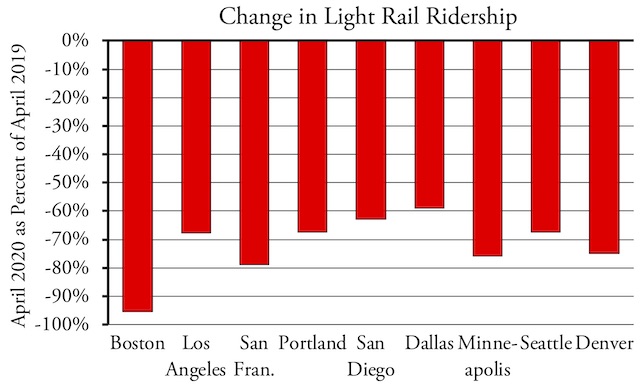
Except in Boston, light rail didn’t do as badly as other rail modes. Shown are the eight urban areas with the highest light-rail ridership before the pandemic.
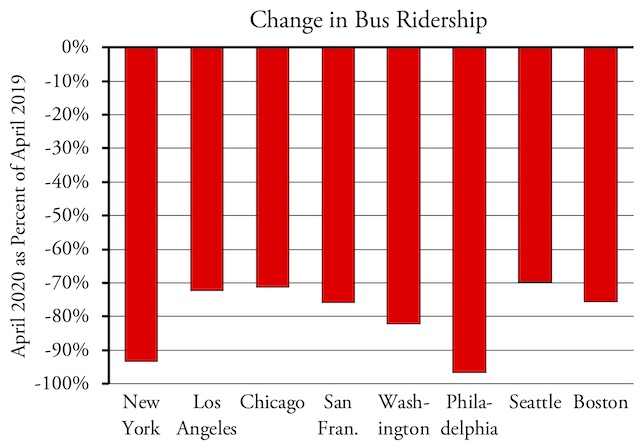
In most regions conventional buses lost 60 to 80 percent of riders. Shown are the urban areas with the most bus riders including all transit agencies in those urban areas; commuter, rapid, & trolley buses not included.
Early in the pandemic some people complained that transit agencies reduced their service by so much that passengers weren’t able to socially distance themselves. Service did decline, but not as much as ridership declined. Nationwide, April service fell by 52 percent compared with the 84 percent decrease in ridership. Similarly, service fell by 18 percent in March compared with a 42 percent decline in ridership. Still, that may not have been enough service to allow for 6-foot distancing during some rush-hour periods.
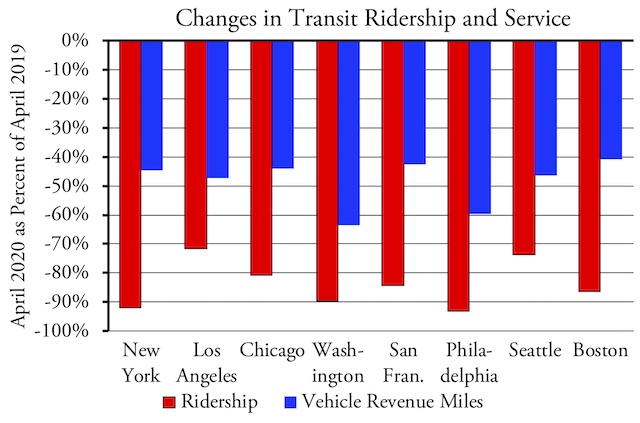
Service didn’t decline as much as ridership, but probably too much to allow social distancing during rush hours.
Will Riders Return?
Transit agency officials are clearly nervous about whether riders will return as the economy opens up again. Agencies are making a big show of sanitizing transit vehicles. But agency employees in both New York and Chicago have complained that they aren’t being given the right tools to property disinfect buses and trains.
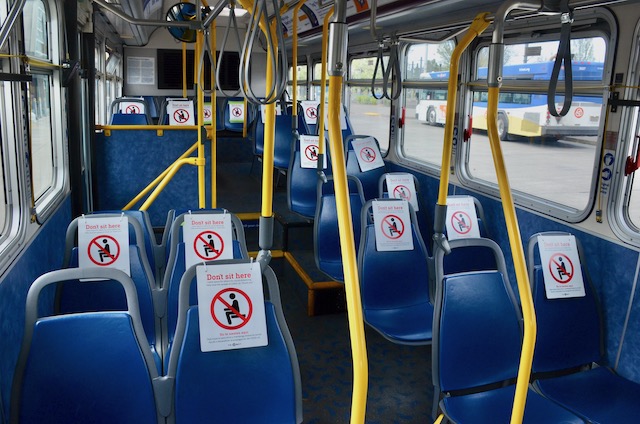
A Portland bus showing that social distancing only allows 10 riders on a 40-seat bus. Photo by Steve Morgan.
It doesn’t help that the Centers for Disease Control have urged employers to give their employees incentives to drive to work rather than take transit. Transit agencies were upset about this, but since they themselves have been telling people not to ride transit at the height of the pandemic they can hardly complain.
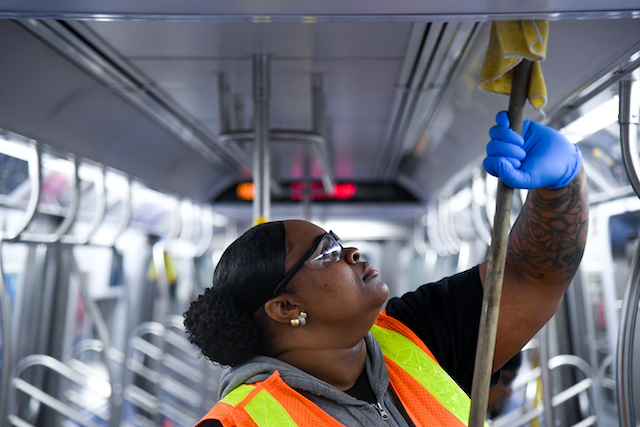
Transit agencies claim to be disinfecting vehicles at least once a day, as if that will do any good if someone sneezes during a morning transit ride. MTA photo by Marc A. Hermann.
“We’ve never had a situation where everyone in authority told the public to avoid public transit,” observes transit consultant Jarrett Walker. “We’re basically training the entire public to view public transit as dangerous. That’s going to take awhile to come back from.”
I’ve posted an enhanced data file that shows the FTA’s raw monthly data in cells A1 through HU2182. Annual totals are in columns HV through IN. Column IO shows the percentage change in ridership between April 2019 and April 2020. Column IP shows the percentage change in ridership between January through April 2019 and the same period in 2020.
Rows 2184 through 2205 show totals by transit mode. Rows 2210 through 3209 show agency totals. Rows 3220 through 3420 show totals for the nation’s 200 largest urban areas. I’ve made these enhancements on both the “UPT” (unlinked passenger trips) and “VRM” (vehicle revenue miles) pages.


Guess is one of the “silver linings” of the largest violation of civil rights in US history based on a massive fear and misinformation campaign and a virus:
–where asymptomatic spread is “very rare”
–where transmission rates outdoors are 0.01%
–that has a death rate at or slightly above seasonal flu
–has a median age of death of 80 to 82, which is higher than average life expectancy
–where the people who die typically had only weeks or months left to live
–where most deaths were nursing home residents
Go ahead. Accuse me of hating old people because I presented facts.
Oh, I forgot to include the fact that it does not spread easily from contaminated surfaces.
Lies and fear, people. Lies and fear.
With the riots and police rhetoric, DONT expect cities to fill up anytime soon.
In San Fran, Realtors shocked as the residents panic and flee. It took One final catalyst for people to flee cities. It’s what leftists do when the ideals they preach reach their doorsteps.
Frank,
agreed. Of course, the recent protests are a fake hoax too. Yes, the officer should NOT have done what he did, but that is not an excuse to burn the country down. The protests are not organic in nature, in any case, but are being organized and funded from the top. As if in some sort of weird agreement, the usual “best friends of the US” wrote a rambling editorial in Haaretz (Israeli newspaper) that opposition to Antifa is inherently anti-Semitic.
From now on, I suspect it will be an endless series of emergencies and panics, using the virus hysteria and other manufactured “outrages” to keep the population alarmed (exactly as noted by Mencken)