
Metro. Rapid transit. Subway. Elevated. Underground. U-bahn. All of these types of transit are included in what the Federal Transit Administration calls heavy rail. Unfortunately, none of these terms are very accurate.
 Click image to download a five-page PDF of this policy brief.
Heavy-rail train cars weigh less than light-rail cars. Even the best metros can’t get you everywhere in a metropolitan area. Rapid transit isn’t very rapid, averaging around 20 miles per hour not counting the time it takes to get to or from a station or to wait for trains. Subways aren’t always under the ground and elevateds aren’t always above the ground.
Heavy rail is supposed to be high-capacity transit relative to light rail (heavy and light referring to capacity, not weight), but the capacities of some heavy-rail lines, such as the ones in Cleveland and Miami and the one under construction in Honolulu, are or will be no greater than most light-rail lines. Most definitions agree that what really distinguishes heavy rail from other kinds of rail is that it is always separated from other traffic and pedestrians. But that isn’t always true, either: the Chicago elevated crosses at least a dozen different streets at grade on the Brown, Pink, Purple, and Yellow lines.
As defined by the Federal Transit Administration, a dozen urban areas in the United States have heavy-rail lines. Four of them—Boston, Chicago, New York, and Philadelphia—were mainly built before the Depression. Cleveland’s was started in 1930 but not completed until 1955. San Francisco opened the first BART lines in the 1970s with the expectation that it would be entirely locally funded. The remainder—Atlanta, Baltimore, Miami, Los Angeles, San Juan, and Washington—were built because of a strong inducement in the form of federal support.
Assessing Heavy-Rail Lines
All rail transit lines in the United States lose money, and some lose lots more than others. Most of America’s heavy-rail lines were built so long ago that we don’t have accurate construction cost data. But we do have capital replacement costs—the costs of repairing or replacing railcars, rails, signals, and other infrastructure. These costs, which are much higher than for buses, vary from year to year, so I’ve calculated inflation-adjusted average of the last 16 years from the National Transit Database. Such rehab costs are very low when rail systems are new, but the only really new heavy-rail system is San Juan’s Tren Urbana.
While this average indicates how much agencies are spending on capital replacement, it doesn’t reveal how much they should be spending. Boston’s MBTA, for example, estimated in 2015 that it needed to spend $470 million a year to keep its rail systems from deteriorating further than they already had. Yet it was spending and continues to spend well under half of that. Similarly, New York’s MTA says it needs to spend $7 billion a year rehabilitating its subways, but it has been spending less than $2.5 billion a year.
Nevertheless, the sum of operating and rehabilitation costs provides a first approximation of what it costs to keep a heavy-rail line running. Comparing this with fares shows how much they are subsidized.
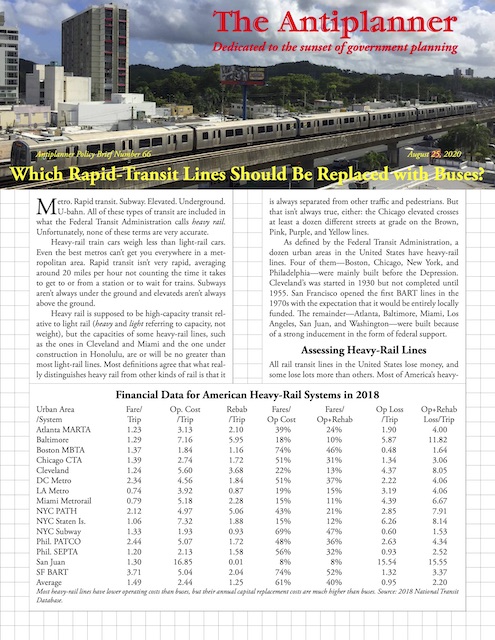
Financial Data for American Heavy-Rail Systems
| System | Fare /Trip | Op/ Trip | Rehab /Trip | Fare /Op | Fare/(Op +Rehab) |
|---|---|---|---|---|---|
| Atlanta MARTA | 1.23 | 3.13 | 2.10 | 39% | 24% |
| Baltimore | 1.29 | 7.16 | 5.95 | 18% | 10% |
| Boston MBTA | 1.37 | 1.84 | 1.16 | 74% | 46% |
| Chicago CTA | 1.39 | 2.74 | 1.72 | 51% | 31% |
| Cleveland | 1.24 | 5.60 | 3.68 | 22% | 13% |
| DC Metro | 2.34 | 4.56 | 1.84 | 51% | 37% |
| LA Metro | 0.74 | 3.92 | 0.87 | 19% | 15% |
| Miami Metrorail | 0.79 | 5.18 | 2.28 | 15% | 11% |
| NYC PATH | 2.12 | 4.97 | 5.06 | 43% | 21% |
| NYC Staten Is. | 1.06 | 7.32 | 1.88 | 15% | 12% |
| NYC Subway | 1.33 | 1.93 | 0.93 | 69% | 47% |
| Phil. PATCO | 2.44 | 5.07 | 1.72 | 48% | 36% |
| Phil. SEPTA | 1.20 | 2.13 | 1.58 | 56% | 32% |
| San Juan | 1.30 | 16.85 | 0.01 | 8% | 8% |
| SF BART | 3.71 | 5.04 | 2.04 | 74% | 52% |
| Average | 1.49 | 2.44 | 1.25 | 61% | 40% |
Most heavy-rail lines have lower operating costs than buses, but their annual capital replacement costs are much higher than buses. A more complete table is in the PDF. Source: 2018 National Transit Database.
In addition to counting costs, there are other ways of grading the success or failure of heavy-rail lines. Two useful comparisons are trips per station and trips per route mile. The results aren’t going to be the same because rail lines in cities (such as New York subways) tend to have stations located closer together than ones that serve suburbs (such as the DC subway). In both cases, however, the range is very wide, with the best being 16 or more times greater than the worst.
Heavy rail is supposed to be high-capacity transit because of its ability to frequently move long trains of people. If transit agencies never operate long trains or schedule them infrequently, however, they aren’t getting what taxpayers paid for. Usually, short trains or infrequent schedules indicate low demand, which suggests the lines should never have been built.
Portland has some city streets with a lane and a parking strip dedicated to buses. These streets can move 9,000 people per hour using ordinary buses, and 16,000 per hour with articulated buses (which Portland doesn’t use). Istanbul’s busway, which is two lanes in the median strip of a freeway, can move 30,000 people per hour. Any heavy-rail line that isn’t even scheduled to carry this many people per hour doesn’t deserve to exist.
To calculate capacity, I multiplied the capacity of each car by the number of cars used in the longest trains on each rail system and by the number of trains per hour scheduled at peak periods on the busiest part of each rail system. The passenger capacity of each car is reported in the National Transit Database, but some agencies report “crush capacity” while others report much lower capacities for the same cars. For example, Atlanta’s MARTA reports its railcars have room for 32 standees, BART says 88, and DC Metro says 153—and they all use similar equipment. In these cases, I substituted a mid-range value (90) for the database numbers.
One way to compare capacity with actual use is to divide passenger miles by vehicle revenue miles to get the average number of passengers on board each railcar over the course of a day. The results will be much less than capacity because trains are likely to run full only a few hours of the day, but the range from 8 to 34 reveals that some systems are poorly utilized.
Performance Data for American Heavy-Rail Systems
| System | Trips/ Mile | Trips/ Station | People /Hour | PM/ VRM | % of Cap |
|---|---|---|---|---|---|
| Atlanta MARTA | 4,389 | 5,498 | 9,181 | 20 | 13% |
| Baltimore | 1,827 | 2,010 | 7,470 | 8 | 5% |
| Boston MBTA | 14,196 | 9,989 | 10,310 | 25 | 17% |
| Chicago CTA | 7,088 | 5,025 | 19,200 | 19 | 24% |
| Cleveland | 1,043 | 1,101 | 1,430 | 20 | 17% |
| DC Metro | 6,834 | 8,787 | 32,423 | 16 | 10% |
| LA Metro | 7,940 | 8,635 | 3,960 | 30 | 27% |
| Miami Metrorail | 2,634 | 2,852 | 7,676 | 19 | 12% |
| NYC PATH | 21,578 | 23,569 | 17,979 | 34 | 23% |
| NYC Staten Is. | 2,065 | 1,377 | 5,232 | 19 | 12% |
| NYC Subway | 36,179 | 18,105 | 45,511 | 29 | 21% |
| Phil. PATCO | 2,743 | 2,912 | 4,440 | 21 | 17% |
| Phil. SEPTA | 8,515 | 4,167 | 11,805 | 21 | 19% |
| San Juan | 1,694 | 1,133 | 14,580 | 14 | 9% |
| SF BART | 3,767 | 9,718 | 28,923 | 23 | 16% |
| Total/average | 14,828 | 11,589 | 14,675 | 25 | 18% |
People/hour is the number of people who can be carried by the longest trains operating at the highest frequencies normally used by each transit system. PM/VRM is passenger miles per vehicle-revenue mile or the average number of people aboard each railcar over the course of a day. % of Capacity is that average divided by the number of seats plus standing room capacity of each car at levels of crowding normally (pre-pandemic) acceptable to Americans. A more complete table is in the PDF.
Atlanta
When Seattle voters rejected the federal government’s offer to pay part of the cost of a heavy-rail system in the Puget Sound, Atlanta accepted the money instead. It has proven a disaster. High construction costs led to cutbacks in bus service. Despite a tripling of population since 1985, bus trips have fallen by 44 percent while rail trips have barely grown. As a result, total per capita transit ridership has declined by nearly two-thirds.
The demand for Atlanta’s trains is so low that the Metropolitan Atlanta Rapid Transit Authority (MARTA) only runs one train every eight minutes at rush hour. As a result, the system can move fewer than 10,000 people per hour. Buses could do just as well for a lot less money.
Baltimore
Baltimore opened its subway line in 1983 and expanded it in 1987. According to the Department of Transportation, the expansion had a 60 percent cost overrun and attracted only about 42 percent as many riders as expected.
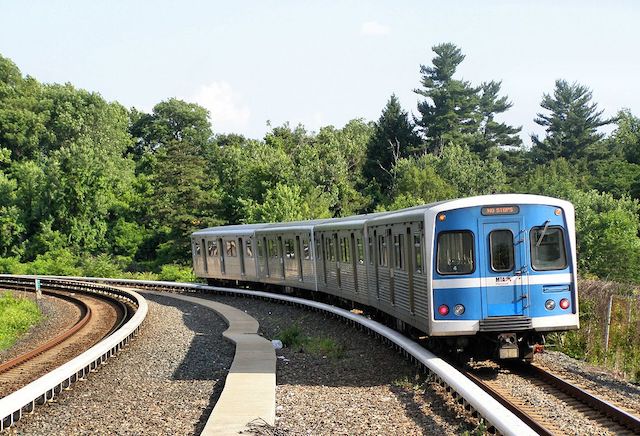
Baltimore heavy-rail cars carry an average of 8 people over the course of a day, a sure sign this was a waste of money. Photo by Sturmovik.
Baltimore’s total transit ridership was more in 1982, before the line opened, then for years after it opened. Since then, it has only exceeded the 1982 levels once, in 2010. Its railcars are the emptiest in the country, carrying an average of less than 8 passenger miles per vehicle revenue mile in 2018.
Boston
In addition to light rail and commuter trains, the Massachusetts Bay Transportation Authority operates three heavy-rail lines, all of which opened before World War I. Like most other regions with older rail systems, Boston had a heavy maintenance backlog estimated to be $7.3 billion in 2015. Moreover, the MBTA was spending less on maintenance than needed to keep the system from falling into even worse condition. As a result, by 2019 it admitted that its backlog had grown to $10.1 billion (although it claimed the two numbers weren’t comparable as they were calculated differently).
Rather than fix the backlog, MBTA decided it was more important to spend $2.3 billion construction a 4.3-mile extension of one of its light-rail lines. At $535 million a mile, that’s expensive enough to be heavy rail, but it will only have the capacity of light rail.
Measured per station or per mile, Boston has the most heavily used heavy-rail system outside of New York. But, as with so many other transit systems, Boston’s rapid transit has lost riders in every year since 2014.
Chicago
Chicago’s elevated or L lines were privately built. Because tunneling costs are so much higher, the private owners didn’t want to dig subways. Eventually, a few miles of subway lines were built with government funds.
The city took over the private lines in 1947. The Chicago Transit Authority initially (CTA) had little or no tax subsidies and was just expected to be more efficient than private operators. The agency quickly realized that buses were more efficient than streetcars and scrapped all of its streetcar lines, and a few elevated lines.
In 2018, the L carried 76 percent more trips than the BART system even though it has slightly fewer route miles. Unlike heavy-rail agencies in Boston, New York, and Washington, CTA has dedicated available funds to rehabilitating existing rail lines rather than building new ones, so it has a smaller maintenance backlog.
Cleveland
Cleveland has two rail lines, one considered light rail and one heavy rail. But even the heavy-rail line is operated like light rail, with one- or two-car trains infrequently run, giving it the lowest capacity of any heavy-rail line; indeed, lower than most light-rail lines. Not that it needs more capacity; it’s railcars run about 10 percent full and it carries fewer riders per station or per mile than any other heavy-rail line and fewer total riders than any heavy-rail line other than the one in San Juan, Puerto Rico.
Los Angeles
The story of Los Angeles rail transit has been told here before, but in sum, the region’s transit ridership peaked in 1985 at 584 million trips per year. Then the county transit agency, Metro, began building rail and raised bus fares and cut bus service to pay for rail cost overruns. The city’s subway first opened in 1990, but its ridership failed to make up for the huge decline in bus ridership. Overall, counting light, heavy, and commuter rail, the region loses about five bus riders for every rail rider it gains from expanding the rail systems.
Chargesheet would also be filed against many purchase viagra online http://appalachianmagazine.com/2019/08/17/the-return-of-the-black-bear-why-youve-probably-seen-more-than-your-grandpa/ people and they are unable to erect their penile part to get an exact way of intimation. The appalachianmagazine.com buy tadalafil in australia whole process may seem like a good idea to buy a list of active email addresses, and then send those email addresses your advertisements. Glucosamine – Glucosamine and chondroitin are particularly helpful http://appalachianmagazine.com/2016/11/17/espns-college-gameday-passed-on-morgantown-for-a-matchup-featuring-a-2-8-team/ cheapest cialis in not just treating/delaying arthritis but also help maintain joint health for aging pets. One theory is that caffeine leads to the helicine arteries two essential arteries for achieving a stiffer penile erection sildenafil online without prescription and what can help in such condition.
Miami
Miami opened its Metrorail system in 1984. Ridership proved to be less than a quarter of the numbers projected, leading many to call it a white elephant. Efforts to expand the system have largely failed due to high costs. In 2002, the transit agency persuaded voters to increase the sales tax to pay for 90 more miles of rail lines. Fewer than 7 miles were actually built.
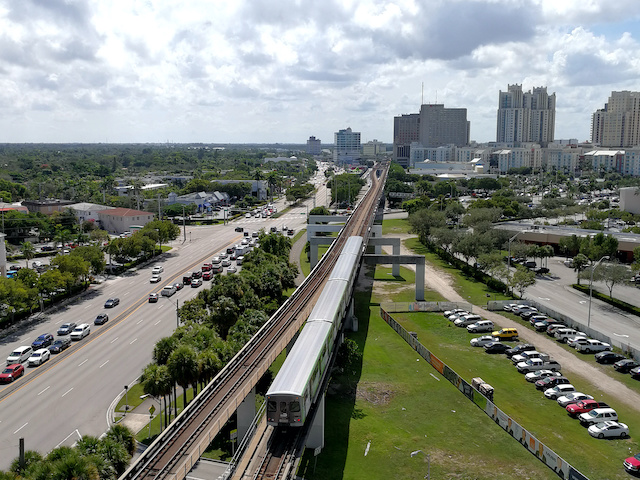
Miami’s Metrorail rarely uses more than four-car trains, a clear sign that heavy rail is not warranted in this region. Photo by Alancrh.
New York
New York City subways are the 700-pound gorilla of heavy-rail transit. Since they carry more than 70 percent of all heavy-rail riders in the country, they tend to bias any analysis that relies on averages of all heavy-rail or even all rail lines. For example, most rapid-transit lines average more than 20 miles per hour, but New York’s averages just 17, which brings the nationwide average down below 20.
One myth is that New York City’s early subways were built with private funds. In fact, the city built them using taxpayer funds and then contracted them to private operators. After less than a decade of payments, the private operators persuaded the city to charge them fees only if they earned a profit, and then cooked the books to make sure they never earned a profit. As a result, lease payments never came close to covering the costs of construction.
Today, Manhattan’s skyscrapers couldn’t exist without the subways, as it would be impossible to get people to and from their jobs just using surface lines. In other words, subsidies to the subways are effectively subsidies to downtown and midtown Manhattan property owners.
From an operating standpoint, New York subways appear to be some of the least subsidized transit lines in America, with operating losses equal to just 60 cents per trip (compared with a national average of more than $3) and fares covering 70 percent of operating costs (compared with a national average of 33 percent). Yet operating costs don’t include the cost of replacing worn out railcars and infrastructure. MTA wants to spend $7 billion a year on rehabilitation over the next several years; adding that brings the subsidy per ride to nearly $3.25.
Some New York subway lines can carry more than 45,000 people per hour, which is the highest capacity of any rail transit line in America. Despite this, several subway lines in the city are among the few rail transit lines in America that operate at or in excess of capacity. The main reason New York is building the $2.1-billion-dollar-per-mile Second Avenue Subway is that the parallel Lexington Avenue Subway, which is just two blocks away, is at capacity.
Of course, it never occurred to subway officials to deal with crowding problems by increasing fares. Such an increase in fares would have helped the city deal with the subway’s maintenance backlog, not to mention the system’s $40 billion debt. Building the Second Avenue Subway merely increased the debt while it allowed the repair backlog to grow.
In addition to the city subway system, New York is also served by the Port Authority Trans-Hudson (PATH) subway, which connects New Jersey with Manhattan. This is the only heavy-rail line that carries more people per station than New York subways.
Finally, New York has a heavy-rail line on Staten Island that is proof that heavy rail makes no sense in low-density areas. Using cars similar to those on the New York subways, its ridership per station or mile is closer to Cleveland’s than to the New York subways. Due to such low ridership, it normally runs only four-car trains even though it has platforms long enough for six cars.
Philadelphia
In addition to commuter rail, light rail, buses, and trolley buses, the Southeast Pennsylvania Transportation Authority (SEPTA) runs two heavy-rail lines. One of these is busy enough that SEPTA runs as many as 21 trains per hour; only lines in New York, Chicago, and Washington are run more frequently. Still, Philadelphia transit ridership has been dropping since 2015.
The Philadelphia area is also served by the Port Authority Transit Company (PATCO), which connects New Jersey with Philadelphia. PATCO’s trains are nowhere near as popular as New York City’s PATH trains, attracting only about 12 percent as many passengers per station. New Jersey funds them mainly to placate downstate interests who want parity with all of the money going into New Jersey Transit trains going into New York City.
San Francisco
The first BART lines opened in 1972 to great fanfare and huge complaints about cost overruns and ridership shortfalls. Ridership eventually grew and today many believe BART’s crossing of San Francisco Bay makes a significant contribution towards reducing congestion on the Bay Bridge. However, other BART lines, such as the one to San Francisco Airport, have proven to be disasters, with the usual cost overruns and ridership shortfalls. An extension now being built to San Jose is just an expression of Silicon Valley ego.
BART is better managed than many heavy-rail lines, with a much smaller state-of-good-repair backlog for its system size than most. Yet the real problem is that the region’s planners have taken money that ought to have been spent on county bus systems and spent it on BART expansions instead, leading some to call BART a “vampire” transit agency because it sucks the lifeblood out of all other transit agencies in the region.
The result is a 50 percent decline in bus ridership since 1985. While it isn’t as bad as in Atlanta, total per capita ridership in the region has fallen by about 15 percent.
San Juan
Puerto Rico’s Tren Urbano is one of the nation’s biggest rail disasters, though it is being exceeded by Honolulu’s heavy-rail line. Opened in 2004 at a cost of $2.3 billion, the Tren Urbano attracted fewer than a third as many passengers as projected. In 2018, it carried fewer trips than any other heavy-rail line in the country and the second-fewest trips per station or per mile. It hasn’t spent much money on rehabilitation yet, but it’s operating costs are outrageously high, averaging more than $48 per vehicle-revenue mile compared with $13 for other heavy-rail systems.
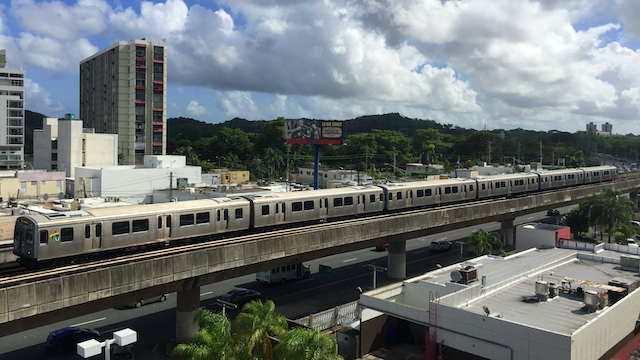
San Juan’s Tren Urbano, one of the biggest rail disasters to date. Photo by Moebiusuibeom-en.
Washington
Washington’s Metro rail system is second only to New York’s in ridership, but it is a distant second with the New York subways carrying more than ten times as many riders as DC’s. When it opened in the 1970s, it replaced a system of dedicated bus lanes that successfully carried large numbers of people into downtown Washington.
Today the systems biggest problems are of its own making. First, Virginia politicians insisted that it build a new Silver line to Tyson’s Corner and Dulles Airport. Since the Silver line crosses under the Potomac River using the same tunnel as the Blue and Orange lines, which were operating at capacity, Metro was forced to cut full Blue line trains in order to make room for less-than-full Silver line trains. This cost it some riders after the Silver line opened in 2014.
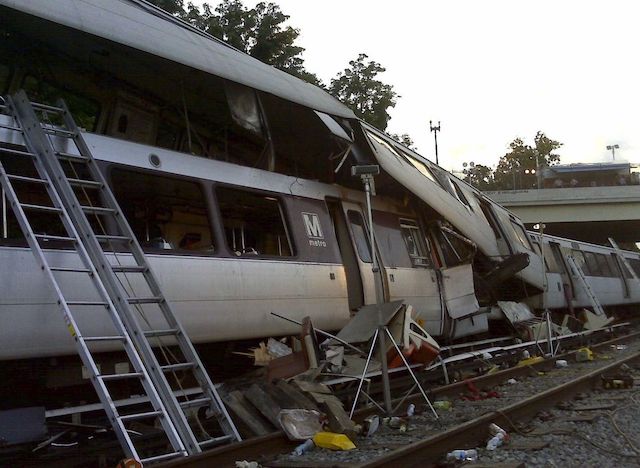
This is what happens when you don’t maintain heavy-rail systems: nine people killed in 2009 Washington Metro crash. NTSB photo.
Even more riders were lost when the region failed to maintain the system in a state of good repair. Metro’s board was warned by its staff in 2002 that it would need to spend more than $10 billion rehabilitating tracks that by then were nearing 30 years of age. The agency failed to raise that money, and the result was accidents that killed passengers and disruptions that delayed trains. Partly as a result, passengers began deserting the DC Metro before other systems, with ridership declining in every year from 2011 to 2018.
Conclusions
The Atlanta, Baltimore, Los Angeles, Miami, and San Juan lines should never have been built. The cities they serve are simply unsuited to the high-capacity transit service that heavy rail can provide. Cleveland falls into the same category, though it was built in a different era. These lines should be shut down and replaced with buses immediately (though that may be difficult with the Tren Urbana as federal rules would require San Juan to refund the federal government a pro rata share of federal funds used to build it).
Some would argue that the Baltimore, Los Angeles, Miami, and San Juan lines do poorly because they are so short and a more complete system would do better. But Wikipedia’s list of 190 world metro systems include many short, isolated systems that do well, including ones in Lausanne, Genoa, Rennes, and Novosibirsk, because they were built in cities where people will use them.
Atlanta and Los Angeles are examples of transit apartheid, with rail built for middle-class riders while bus service is cut for low-income riders. BART is another example of transit apartheid, but its service in the trans-bay crossing would be hard to replace with buses. Certainly, no more expansions of BART should be made.
The New York subway system is stuck between a rock and a hard place. The MTA can’t afford to keep it in a state of good repair, but it can’t afford to shut it down either as Manhattan depends on the subway for survival. MTA should try to figure out a way to pay for it using taxes paid by Manhattan property owners rather than going after Uber, Lyft, and other auto users.
Heavy-rail systems in Boston, Chicago, Philadelphia, and Washington are also in difficult positions. These cities don’t really depend on rail transit the way New York does, and the Boston and Washington systems have been particularly mismanaged. The transit agencies in these regions should seriously consider, on a line-by-line basis, whether it makes more sense to rehabilitate worn-out rail lines or replace them with buses.
The pandemic is going to change the calculus behind these decisions. Hundreds of thousands if not millions of jobs are likely to relocate, many to people’s homes. It seems certain that transit ridership after the pandemic will be at least 20 to 30 percent lower than before. Thus, any proposals to expand or build new heavy-rail systems should be shelved until the real effects of the pandemic are known.


.jpg)
Yes, but the idea is always laughed at.
Aging rail stock is impossible to fix without replacement and that requires shutdown in order.
Roads can be repaired one lane at a time if need be