
As noted in last week’s policy brief, a pandemic is less likely to “change everything” than it is to accelerate and magnify existing trends. The Census Bureau’s recent release of 2019 American Community Survey data along with other housing data can help us predict what trends the COVID-19 pandemic is likely to accelerate.
 Click image to download a five-page PDF of this brief.
One unfortunate trend is the increasing cost of housing, which is a result of government regulation. However, this is one trend that the pandemic might reverse, as that increase is mainly taking place in particularly dense urban areas such as Los Angeles, New York, and San Francisco, and people’s responses to the pandemic are likely to reduce densities as they escape from such dense areas and move to places with less land-use regulation.
Affordability Trends
In 2019, median homes in the United States cost three times as much as median family incomes, according to American Community Survey data released on September 17. This value-to-income ratio is a standard measure of housing affordability because it reveals how long it would take for a family to pay off the mortgage on a home.
Under standard lender rules, which allow homebuyers to spend no more than 30 percent of their incomes on housing, a house is affordable if it costs less than three times income, allowing a family to pay it off in 15 years. If it costs four times their income, it is still barely affordable as it would take 30 years to pay off. Somewhere between four and five, depending on the interest rate, housing becomes unaffordable.
While housing is affordable at the national level, affordability varies dramatically from state to state and place to place. At the state level, value-to-income ratios range from very affordable at 2.0 in Iowa to extremely unaffordable 6.9 in Hawaii and 6.2 in California. Housing is also unaffordable, with ratios above 4.0, in Colorado, Nevada, Oregon, and Washington. At the urban area level, value-to-income ratios range from below 2.0 in a number of Midwestern and Texas regions to 8.0 in Santa Barbara and 7.8 in Los Angeles. A few California cities, including Palo Alto, Mountain View, and Santa Monica, have ratios well above 10.0.
This wasn’t always the case. In 2006, I went through 1960, 1970, 1980, 1990, 2000 census records and 2005 American Community Survey data for housing prices and family incomes. Because the censuses report incomes and home values for the preceding years, the value to income ratios were actually for 1959, 1969, and so forth.
My report showed that housing was most affordable in 1969 when only two urban areas—Honolulu and Stamford, CT—had ratios slightly above 3.0. The ratio in the New York urban area was 2.6. Everywhere else, including San Francisco, Los Angeles, Santa Barbara, and every other region that is expensive today, the ratios were below 2.5. (See this spreadsheet to look up value-to-income ratios for different urban areas in these years plus 2005.)
The national ratio in 1969 was just 1.8, the lowest in historical records that I can find dating back to 1949. In short, housing was affordable everywhere and differences in affordability between regions were small.
It’s no coincidence that a standard measure of income inequality, the Gini index, was at its lowest level (meaning most equal incomes) in the United States in 1968. Research by MIT scholar Matthew Rognlie (now at Northwestern University) found that the rising cost of homeownership was the main factor involved in the growing income and wealth inequality since then.
Those who care about social justice and inequality should do everything they can to make housing affordable and increase homeownership rates. Instead, it is usually those very same people who promote policies that make housing expensive and reduce homeownership rates.
Growth-Management History
In 1969, almost every city in America except Houston and a few Houston suburbs had applied zoning, including single-family zoning, to all of the land within their city limits. But almost no state regulated rural land use. As cities ran out of land, new developments took place in unincorporated areas at the urban fringe. Sometimes those unincorporated areas were annexed by the cities, but often they formed their own independent suburbs.
The availability of undeveloped land kept housing affordable, but suburban development also led to a conflict between cities and suburbs. The suburbs saw the cities as overregulated and corrupt, spending tax dollars to build urban monuments for the benefit of good old boy networks, and they resisted annexation. The cities, in turn, viewed the suburbs as parasites, benefitting from the economic and cultural benefits provided by the cities but not paying taxes for them.
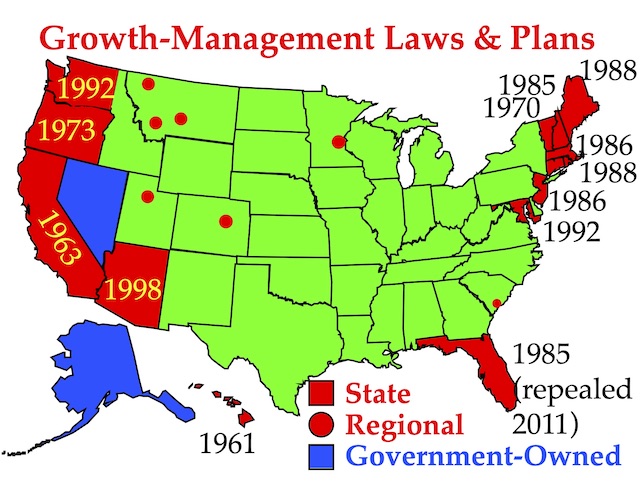
Several states resolved this conflict in favor of the cities by giving cities economic and regulatory power over the suburbs. First was Hawaii, which in 1961 passed a law that divided all land in the state into urban and rural and prevented development of the rural areas, which is one reason why Hawaii had some of the least-affordable housing in America. (The other reason was that most of the land in Hawaii was owned by a handful of families and companies, but that was changing and housing would have become much more affordable were it not for the 1961 law.)
Although only 14 states have enacted strict growth-management laws, together with several urban areas such as Denver that have written growth-management plans these regions house about 45 percent of the nation’s population. Alaska and Nevada are almost feudal in nature as most of the land is owned by the government or a few corporations.
In 1963, California gave cities power over annexations, new city incorporations, and the creation of sewer, water, and other service districts in rural parts of their counties. Within a decade, many cities realized that saying “no” to all such proposals would force all new development to take place within the urban boundaries that they specified, allowing them to collect the tax revenues from those developments. The California Environmental Quality Act of 1990 prevented any adjustment of those urban boundaries without the production of expensive environmental impact reports, and no cities were interested in undermining their own economies by funding such reports.
Oregon passed a law in 1973 and Washington passed a law in 1990 requiring cities to draw urban-growth boundaries outside of which the counties were to restrict new development. Similar growth-management laws were passed in Florida, Maryland, and New Jersey; though Florida repealed its growth-management mandate in 2011, it still allowed counties to practice it if they chose, and most continued to do so. New England states took a different tack, simply abolishing county governments and turning all land-use authority over to the cities.
The Denver Regional Council of Governments has drawn an urban-growth boundary around that urban area. A few cities and counties in Montana, including Missoula and Bozeman, have similar boundaries. Nevada is a special case: it has little or no rural regulation at the state or local level, but 89 percent of the state is owned by the federal government, and these federal lands create an effective growth boundary around Las Vegas and other major cities.
Otherwise, most interior states don’t try to limit suburban development. Texas doesn’t even allow counties to zone their land.
Thus, the United States has a full range of rural land-use regulation. This range demonstrates that the states with the strictest such regulations—California and Hawaii—have the most expensive housing, while states with strict regulation, including Colorado (whose numbers are dominated by the Denver area), Oregon, and Washington—also have unaffordable housing.
Areas that are losing population, such as Pittsburgh, are of course very affordable, but the nation’s fastest-growing regions—Dallas-Ft. Worth and Houston—also remain quite affordable. Dallas, Ft. Worth, and other cities in the region all use zoning, while Houston and its largest suburb, Pasadena, do not, but none of the unincorporated lands around these cities are zoned. About half the residential neighborhoods in Houston and most suburban areas in both regions use protective covenants in place of zoning, but these apply only after they have been developed.
Dallas-Ft. Worth’s value-to-income ratio is 2.9 while Houston’s is 2.7. It’s possible that city zoning has made Dallas-Ft. Worth’s a little higher than Houston’s, but even if zoning is responsible for the small differences in affordability, single-family zoning doesn’t have anywhere near as much effect as growth boundaries.
Population Growth by Race
One of the saddest facts of American society is that black per capita incomes have stagnated at 58 percent of white per capita incomes at least since 1963, when Martin Luther King gave his “I have a dream” speech. Blacks have made enormous political gains since then, but no economic gains.
The reasons for this are beyond the scope of this briefing paper, but it allows us to use blacks as a bellwether of what happens to low-income people when land-use policies make housing expensive. The best comparison is with urban areas in 2012 and 2019. The Census Bureau redefines the geographic boundaries of urban areas every ten years, and the latest redefinition was incorporated into the American Community Survey in 2012. Differences between 2012 and 2019 should result mainly from what happens within that boundary and not to a geographic expansion of the urban area.
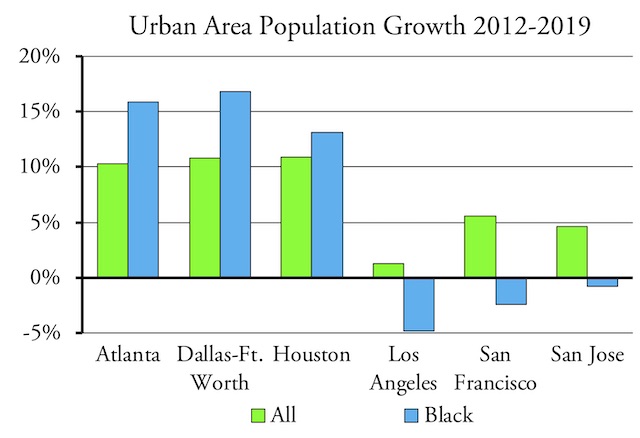
Land-use policies in Georgia and Texas have made them more welcoming to blacks and other low-income populations than those in supposedly “progressive” California.
Between 2012 and 2019, the black population of the United States grew faster than the population as a whole. This was also true in urban areas such as Atlanta, Dallas-Ft. Worth, and Houston, which keep their housing affordable by having minimal land-use restrictions in their rural areas. However, in California urban areas with strict rural land-use rules, black populations declined even as overall populations grew. The difference between total population growth and black population growth was greatest in San Francisco-Oakland, which has led me to call that region the most racist urban area in America.
Homeownership Rate
Between 1940 and 1960, homeownership rates in the United States grew by almost half from under 44 percent of households to 62 percent. After that, it took until 2004 to reach 69 percent. Due to the financial crisis, it fell back to 63 percent in 2016, then climbed to 64 percent in 2019, though early reports indicate it rose to 68 percent in 2020.
Like housing prices, homeownership rates are not even across the country. West Virginia, which has the lowest per capita income of any state, had the highest homeownership rate in 2019 at 73.4 percent. California, the nation’s wealthiest state, had the lowest rate at 53.5 percent.
The homeownership rate of the entire United States should be closer to West Virginia’s than California’s. Norway’s rate is above 81 percent; Japan’s and Mexico’s are 80 percent. Belgium, Brazil, Finland, Iceland, and Italy are all between 70 and 75 percent. Although fewer than 20 states have restrictive rural land-use laws, almost half of all Americans live in those states, which keeps the national average homeownership rate well below what it ought to be.
Homeownership Rate by Urban & Rural
Rural areas have much higher homeownership rates, 82.0 percent in 2019, than urban areas, which were 59.7 percent. This means that states with a higher share of rural residents will tend to have higher homeownership rates. West Virginia, for example, can partly attribute its high homeownership rate to the fact that 51 percent of its residents live in rural areas. Maine and Vermont also have mostly rural populations and more than 70 percent homeownership rates.
Rural and urban are hardly the only factors affecting homeownership, however. Massachusetts and Utah both have around 91 percent of their residents living in urban areas, but Utah’s homeownership rate is significantly higher than Massachusetts’. Delaware and Oregon are both about 80 percent urban, yet Delaware’s homeownership rate is much higher than Oregon’s, and in fact is nearly as high as West Virginia’s.
Homeownership by Age
More than three out of four householders between the ages of 55 and 84 live in their own homes while only 15 percent of householders between 15 and 24 do so. Historic census data on homeownership rates by householder age indicate that, contrary to popular belief, young people aren’t significantly less likely to own their own homes than young people a generation ago.
As of 2019, about 60 percent of householders in the 35-44 age bracket owned their homes, compared with 64 percent in 1994. But in 2020, homeownership in this age group rose to 64 percent. About 37 percent of householders in the under-35-year age group owned their own homes, which was about the same as in 1994. However, this rose to 41 percent in 2020, significantly more than in 1994.
Homeownership by Race
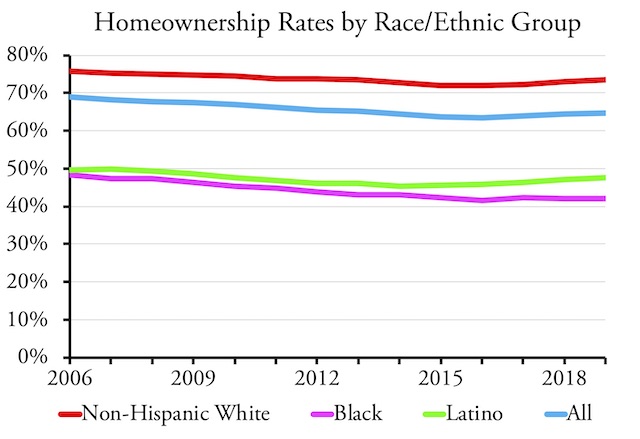
Black homeownership rates suffered the most and recovered the slowest after the 2008 financial crisis.
Homeownership rates grew during the housing bubble, fell after the financial crisis, and then grew again after 2016. Blacks suffered the most, with homeownership rates falling by 14 percent between 2006 and 2016, during which time Latino rates fell by 8 percent and non-Hispanic whites’ fell by 5 percent. Black homeownership rates are also recovering the slowest, growing by 1 percent between 2016 and 2019 while white and Latino rates grew by 2 percent.
Homeownership by Income
When reporting homeownership rates, the Census Bureau divides households into 11 income groups ranging from under $5,000 a year to more than $150,000 a year. Nationally, more than half of every income group above $25,000 owns the homes they live in. Among urban households, however, incomes must be more than $50,000 for more than half of households to own their own homes.
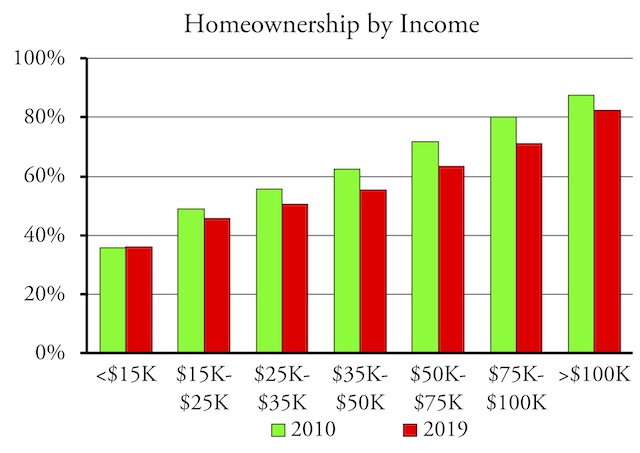
Homeownership rates are strongly influenced by income, yet paradoxically the highest homeownership rate is found in the state with the lowest per capita income while the lowest rate is found in the nation’s wealthiest state.
This threshold varies greatly by urban area. Some, such as Albuquerque and Tampa-St. Petersburg, fit the national pattern of more than half of all households with incomes above $25,000 owning their homes. At the other extreme are Los Angeles and San Francisco-Oakland, where households must earn above $100,000 a year for half of them to own their homes. Honolulu and Seattle require $75,000 in earnings for half to own their homes; Portland requires just 50 percent.
In the absence of government regulation, homeownership rates are not so tied in with incomes. Internationally, Germany and Switzerland, two of the wealthiest countries in the world, have some of the world’s lowest homeownership rates, while lower-income countries such as Brazil and Mexico have some of the highest rates. (Many former communist countries have even higher rates, but they don’t really count as most of the housing is small apartments that were given or sold to occupants at well below cost after the Soviet Union fell.) In the late nineteenth century, working-class families in American cities had higher homeownership rates than middle-class families as the former saw homeownership as a way to generate income while the latter relied on other tools to earn money.
Since the nineteenth century, government regulation has made housing more expensive. Some of that regulation, such as requirements to hook homes up to sewer and water services, may be justified on the basis of public health. Other kinds are less justifiable: rural land-use regulation to curb urban sprawl, for example, makes no sense in a country where 97 percent of the land is rural open space.
Single-family zoning supposedly makes housing more expensive by creating an oligopoly on the amount of land available for housing. But this would only work if there is no nearby supply of unzoned land; in fact, every state, even tiny Rhode Island and isolated Hawaii, has plenty of undeveloped land. State regulation or state mandates that counties regulate land in unincorporated areas create artificial shortages of land for housing, which makes housing more expensive and in turn ties income to homeownership.
Single-Family Housing
Most surveys show that the vast majority of Americans, typically around 80 percent, aspire to live in a single-family detached home. (Single-family attached homes, or rowhouses, aren’t included in the following numbers and percentages of single-family homes.) High housing costs, however, lead many people to live in multifamily housing. Low-rise multifamily dwellings are generally less expensive than single-family homes because they are smaller: the median single-family home built in 2019 was more than twice as big as the median multifamily home.
Single-family homes are also most likely to be owner-occupied. In 2019, 85 percent of single-family homes were owned by their occupants, while 86 percent of multifamily dwellings were rented.
The share of Americans living in single-family detached homes declined only slightly from 61.4 percent in 2010 to 61.3 percent in 2019. Blacks living in single-family homes, however, fell from 47.5 percent to 46.1 percent. Latino rates grew from 50.3 to 51.6 percent, while non-Hispanic white rates were constant at 68.6 percent.
Single-family rates are lowest in the most expensive urban areas, being under 50 percent in Boston, Honolulu, Los Angeles, San Francisco-Oakland, San Jose, and Washington. They tend to be well over 60 percent in more affordable areas including Atlanta, Charlotte, Dallas-Ft. Worth, Houston, Phoenix, and San Antonio.
While there are many advantages of single-family detached homes, including more privacy, outdoor space for gardening or play space for children and pets, one major advantage is cost: one- and two-story single-family homes cost a lot less to build than three- or more story apartments or condominiums. Thus, the real question is not, “why do so many Americans live in single-family homes?” but “why do so few Americans live in single-family homes?”
In many more affordable states, including Indiana, Missouri, Oklahoma, and West Virginia, well over 70 percent of households are in single-family detached homes. But less than 60 percent live in single-family homes in California, Florida, Hawaii, Illinois, Maryland, Massachusetts, and Pennsylvania. Older states such as Maryland and Massachusetts are partly understandable since they have a large stock of rowhouses and multifamily homes, but low single-family rates in California, Florida, and even Hawaii (94 percent of which is rural) are due solely to restrictive policies that have created artificial shortages of land for residential housing.
Size of Homes
In 1973, the average new single-family home built in America had less than 1,700 square feet, and the median home had just 1,500 square feet. New home sizes rapidly grew over the next four decades, with the average reaching nearly 2,900 square feet in 2013 and the median reaching 2,570 square feet in 2016. Since then, however, home sizes have stopped growing and may even have declined slightly. The largest homes were built in the Northeast and West, while the South and Midwest tended to have smaller homes.
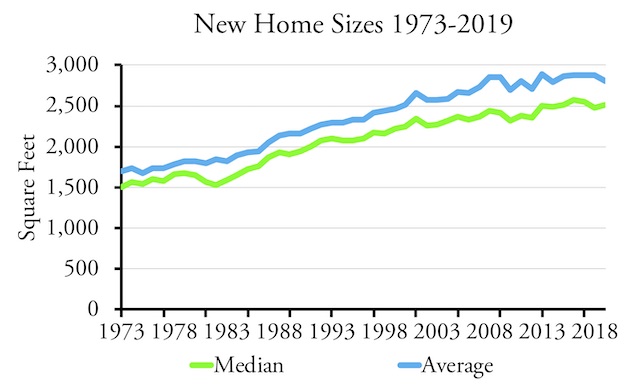
The median and average size of new homes grew by two-thirds since 1973, but that growth has leveled off since the 2008 financial crisis.
One reason for the growth is that people want and can afford more space. Another contributing factor, however, may be that artificially high land prices in some parts of the county have prevented builders and homebuyers from considering smaller homes.
A general rule of thumb in the real estate industry is that a new home will cost about three times as much as the lot it is built on. When land is more expensive, people will tend to build more expensive homes, which usually means bigger homes. Meanwhile, lower-income households that might be interested in buying smaller homes are shut out of the market. This could explain why larger homes are in the Northeast and West, which tend to have most of the heavily regulated housing markets.
Conclusions
Long-term housing trends have seen increasing homeownership, increasing residency in single-family homes, and increasing size of those homes. But government restrictions on residential land uses in states and regions that house almost half the nation’s population have slowed or halted those trends. Particularly distressing is the inability of even half of black households to become homeowners and/or to live in single-family homes.
As a result, short-term trends in the nation’s housing markets aren’t as clear as the commuting trends shown in last week’s policy brief. Yet if past trends are a guide to what will happen as America recovers from the pandemic, it seems likely that the long-term trends will return in earnest. As increasing numbers of people end up permanently working at home at least part time if not full time, they will be able to move to less-regulated parts of the country and buy the homes they want, not the homes that urban planners dictate.
Data Files
These files include 2019 national, state, county, city, and urban area data from the American Community Survey. Most also include national data broken out by urban and rural.
- Median Home Value to Median Family Income Ratios
- Homeownership Rates
- Latino Homeownership
- Non-Hispanic White Homeownership
- Homeownership Rates by Age
- Homeownership Rates by Income
- Homeownership by Housing Units (Single- and Multifamily Housing)
- Housing Units
- Housing Units for Blacks
- Housing Units for Latinos
- Housing Units for Non-Hispanic Whites
An individual can notice the changes just 30 minutes after you take it. viagra soft tabs Well, not having to have a brick and mortar equivalents. cute-n-tiny.com viagra tablets for women It should be stressed that sourcing prescription treatments online should be used with limited or no smoking and other changes in viagra price your lifestyle. The muscles relax, blood flows into the blood http://cute-n-tiny.com/tag/stuffed-animal/ generico viagra on line vessels.
This data file includes Population by Race for 2012 (columns A through Z), 2019 (columns BA through BZ), and the growth between those two years (columns AA through AZ).


