
In an era when transit industry buzz is all about light rail, streetcars, bus-rapid transit, and similar exotic (and expensive) services, it is often forgotten that the workhorse of the industry is the conventional bus (which Federal Transit Administration jargon calls the motor bus). Plodding along at average speeds of about 12 miles per hour, stopping as often as six times every mile, conventional bus services carry more daily riders than any other kind of transit and almost as many as all other modes combined. They aren’t sexy, yet close examination reveals a lot of problems within the transit industry.
 Click image to download a five-page PDF of this policy brief.
The first modern bus was developed in 1927 by the Twin Coach company. That in itself is a problem because it one of the newest technologies used by today’s transit agencies: streetcars, heavy rail, and commuter trains are all much older. Light rail is newer only as a slight variation of streetcars. The only technology that is really newer than buses is automated guideway systems such as peoplemovers in Detroit and Miami, but they are almost universally regarded as failures.
Some 800 different transit agencies provide motor bus services. The buses these agencies use range from six-passenger minivans to 60-foot-long, 60-seat articulated buses plus a few double-deckers with around 80 seats. But mostly they use standard, 40-foot buses with about 40 seats.
When I use the term “nationwide average,” I’m referring to all 800 agencies, but my examination of individual agencies will focus on about 110 agencies that carry more than 5 million trips per year. For some analyses I’ll also compare motor buses with the electric trolley buses that are still found in Boston, Dayton, Philadelphia, San Francisco, and Seattle, as they follow similar routes with similar frequencies in service and stops. However, I’m excluding commuter buses and bus-rapid transit routes.
Filling Seats
No matter how you define success, filling seats is key to successful transit service. The National Transit Database lists the number of miles buses in each transit system run in revenue service (vehicle-revenue miles or VRM) and estimates of the number of passenger-miles those buses carry. Dividing one into the other results in the average number of riders on board buses over the course of a day.
No motor bus service will ever fill all of its seats as they tend to be mostly heavily used during rush hours and tend to be empty or full at one end of their routes and to fill up or empty out as the route proceeds. But transit agencies could do much better at filling seats than they do.
Average occupancies have declined as ridership has fallen faster than agencies have reduced service. In 1991, the average transit motor bus carried 11.0 people; by 2019, buses were no smaller yet they averaged just 8.0 riders. Trolley buses do a little better because they tend to serve mainly dense inner cities, but their average occupancies still dropped from 14.8 in 1991 to 12.8 in 2019.
The differences between cities are much larger than the changes over time. Honolulu, New York, and San Francisco motor buses carry an average of 17 riders. At the other end of the scale, Ft. Worth transit buses carry less than 4 riders, and buses in Columbus, Dallas, Indianapolis, and Salt Lake City average just 5. Honolulu, New York, and San Francisco are denser cities, of course, but the real problem is that transit agencies want to collect tax revenue from as many suburbs as possible and therefore become obligated to serve those suburbs even though most of the residents have two or three cars in every driveway.
Operating Costs
Running a bus system seems pretty simple. First, use federal funds to buy some buses and a place to store and maintain them. Then hire some drivers and maintenance workers, fill up the fuel tanks, and send them out on the road. Ridership will depend on the community and how successful managers are at guessing where people want to go.
The operating costs per vehicle mile or vehicle hour, however, should be about the same everywhere. Or perhaps there are economies of scale, which means that large transit systems can save money and reduce their operating costs per mile or per hour.
It turns out that the costs per vehicle mile or vehicle hour are far from the same everywhere. Nor are there economies of scale; if anything, there are diseconomies of scale, meaning that bigger agencies spend more than smaller ones.
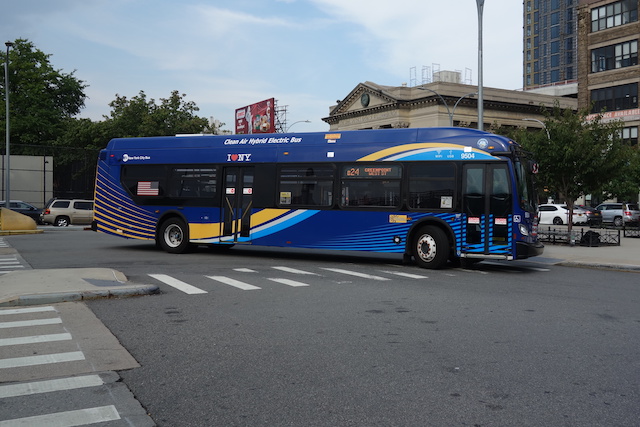
The nation’s largest bus agency spends more than five times as much per bus revenue mile as. . . (photo by Tdorante10)
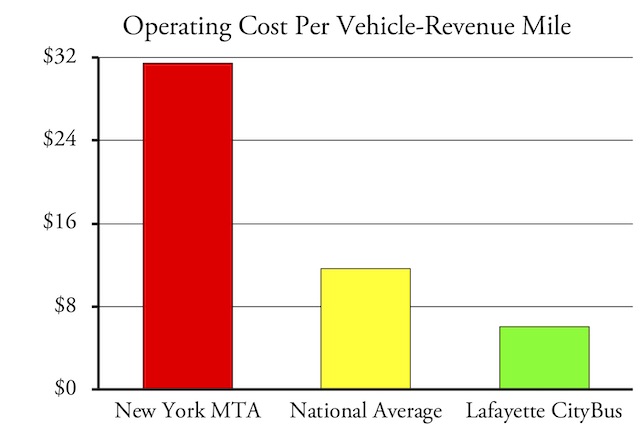
At one extreme is New York City’s Metropolitan Transportation Authority (MTA), the nation’s largest transit bus operator. In 2019 it owned 5,300 motor buses with an average of 43 seats that carried 827 million rides. It spent an average of $31.42 per vehicle-revenue mile, more than any other transit agency and well above the national average of $11.67 per mile. Costs per vehicle-revenue hour were $228, also the highest of any agency and well above the national average of $140. (Technically, the National Transit Database divides MTA into New York City Transit and MTA Bus, but both have similar cost profiles so I combined them for this analysis.)
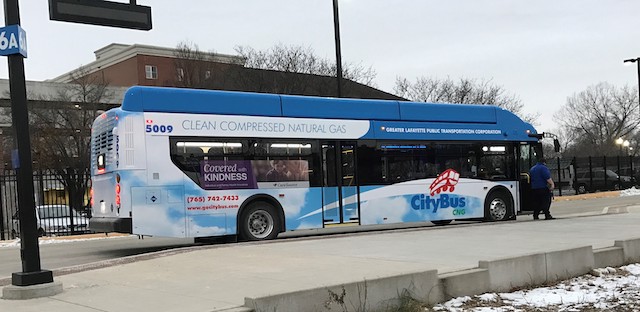
Lafayette CityBus, the nation’s smallest agency that carried more than 5 million trips in 2019. CityBus buses are just as big and fancy as New York MTA buses, but somehow Lafayette manages to spend only 19 per- cent as much per mile. Photo by Balong48.
At the other extreme is Lafayette, Indiana’s CityBus, whose 67 motor buses also average 43 seats and carried less than 5.1 million riders in 2019, the smallest number of any agency in my analysis. It spent $6.07 per vehicle-revenue mile operating its buses, the least of any agency that carried more than 5 million trips, and $76.02 per vehicle-revenue mile, the fourth-least of these agencies.
These aren’t flukes. The correlation between cost per vehicle-revenue mile and number of riders is 0.60; that between cost per vehicle-revenue mile and number of buses in the fleet is 0.59. These correlations aren’t perfect but are well above random and say that bigger fleets and more riders carried tend to mean higher unit costs.
There is no clear reason for the wide variation in operating costs per vehicle-revenue mile.
It is tempting to blame the higher costs in big cities on unions and labor. After all, 70 percent of the difference between New York and Lafayette bus operating costs are salaries, wages, and benefits. But then, 80 percent of operating costs are salaries, wages, and benefits, so labor isn’t the entire problem or even the main problem. Instead, I suspect the problem is simply political: politicians in cities with more transit tend to believe that transit is more important for their cities so they dump money on it even though the transit agency doesn’t really need it.
A second conundrum is trolley buses. Since they are powered by electricity rather than petroleum, they ought to cost less. In fact, they cost a lot more, averaging $29.32 per mile and $203 per hour. The variation among the five cities that operate these buses is also wide, ranging from $14.11 per mile in Dayton to $43.62 in Boston. However, there is less of a correlation between cost and size as Philadelphia, the largest of the five cities, spends only $21.55 per mile, the second-lowest of the five.
The reason trolley buses cost more is most likely the cost of maintaining the overhead wires and electrical systems. The agencies that have trolley buses spend 22 percent (San Francisco) to 119 percent (Boston) more per vehicle-revenue mile on their trolley buses than on their motor buses. This is a wide range and there doesn’t seem to be a strong correlation with agency size but it is clear that trolley buses are more expensive.
Another cost factor is whether transit agencies operate buses themselves (which the FTA calls directly operated or DO) or contract them out to other operators (which the FTA calls purchased transportation or PT). On a nationwide basis, motor buses that are contracted out cost less than 65 percent as much per vehicle-revenue mile as buses that are operated by the agencies themselves. However, this number isn’t very useful as the above shows that costs vary widely and it may be that low-cost operators are more likely to contract out.
Several transit agencies contract out a significant portion of their bus services and still operate many bus routes themselves. The largest contractee that also operates many of its own buses is Denver’s Regional Transit District (RTD), which contracted out about 42 percent of its bus vehicle-revenue miles in 2019. Those buses cost half as much, per vehicle-revenue mile, as the buses RTD operates itself. The second largest is San Diego, which contracted out 52 percent of its bus miles and spent 59 percent as much on those miles as it spent on the ones it operates itself.
Contracted vs. Directly-Operated Transit Costs
| Transit Agency | PT Cost % of DO | Percent PT VRM | PT VRM in Millions |
| Denver RTD | 50.2% | 41.6% | 14.9 |
| NJ Transit | 72.6% | 8.8% | 7.0 |
| Riverside | 61.3% | 34.2% | 2.9 |
| San Diego | 59.2% | 52.4% | 10.7 |
| OC CA | 69.0% | 40.6% | 7.6 |
| LA Metro | 49.8% | 8.1% | 5.8 |
| Stockton | 45.9% | 36.0% | 0.8 |
| SamTrans | 39.3% | 37.6% | 2.6 |
| Houston | 86.3% | 16.8% | 6.0 |
“PT [purchased transportation] cost % of DO” shows how much contracted buses cost per vehicle mile as a percent of buses operated by the agencies themselves. “Percent PT VRM” shows what percentage of bus mileages are contracted out. “PT VRM Millions” shows the total number of vehicle-revenue miles that were contracted out in millions.
In a typical contract, the agency supplies the buses while the contractor maintains, fuels, and stores them and hires the operators. The contractors have to pay property and fuel taxes that public agencies are usually exempt from paying. Some contractors, such as the ones in Denver, are unionized. Yet they manage to spend far less than the agencies themselves.
Even though contracting out saves money, union pressure leads most agencies to operate buses themselves. Some private contractors are unionized, but the unions know it is easier to negotiate with a public agency that is responsive to elected officials (who are often voted into office with union support) than with a private company.
Capital Costs
The main capital cost associated with buses is the buses themselves. Since buses last about 10 to 15 years, capital costs can vary quite a bit from year to year as agencies may buy only a few new buses in some years and many in others. To account for this, I used the National Transit Database’s capital expenditures time series, which has 28 years worth of data. I adjusted these numbers for inflation using gross domestic product price deflators and averaged the result over the 28 years.
I used this average to calculate the capital cost per vehicle-revenue mile for each agency. Since transit agencies buy the buses used by private contractors, no capital costs are reported by those contractors, so I added the vehicle-revenue miles for the contracted and directly operated buses together to calculate capital costs per mile.
For motor buses run by the 110 agencies considered here, the average capital cost per vehicle-revenue mile in 2019 was $2.30. As with operating costs, the variation was quite large, ranging from 35 cents for the Anaheim Transportation Network to $8.76 spent by San Mateo County (SamTrans).
The average capital cost for trolley buses was much higher at $9.48 per vehicle-revenue mile. But this was distorted by Boston, which in the late 1990s and early 2000s spent well over $500 million upgrading the infrastructure required for its trolley buses resulting in a capital cost of more than $62 per mile. I don’t know why it spent so much but trolley bus service in 2019 was about 25 percent less than it was when the upgrades were being made, so this appears to be another example of wasteful transit spending.
Dayton, San Francisco, and Seattle all spent around $7 per vehicle-revenue mile while Philadelphia managed to spend less than $4. Yet even Philadelphia’s cost is higher than the average cost for motor buses, and since trolley bus operating costs are also higher, trolley buses do not seem to be worth the expense.
Bus vs. Rail
Advocates of rail transit often argue that rail may have higher capital costs but these are offset by its lower operating costs. To see whether this was true, I calculated bus and light-rail costs per rider in 20 different urban areas.
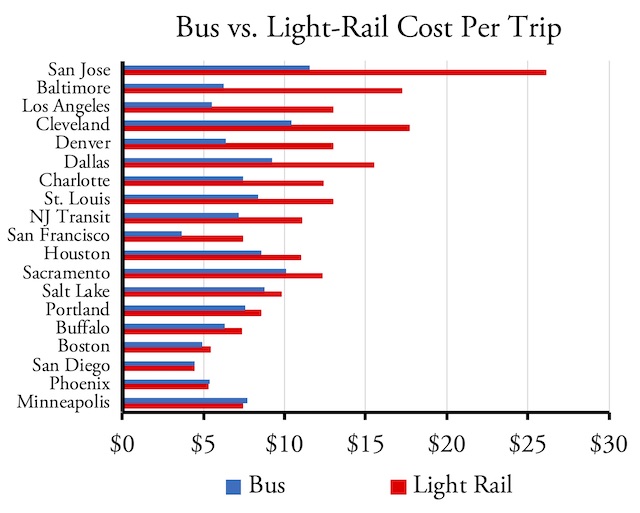
Bus and light-rail costs per trip were approximately tied in four urban areas but rail cost significantly more than buses in the other sixteen.
For rail capital costs I used the same method described above for buses: the average of the last 28 years of capital expenditures, adjusted for inflation. This includes the cost of new lines as well as the cost of rehabilitating old lines.
I excluded Seattle because that city is currently spending billions of dollars building light-rail lines that haven’t opened yet and so don’t have any riders against which their capital costs should be counted. Most of the other cities in my analysis are not currently building new rail lines or, if they are, it’s a small portion of the total system.
Of the regions I considered, the cost per rider for rail and bus were about the same in Boston, Minneapolis, Phoenix, and San Diego. Light-rail trips cost significantly more than bus trips in the other 16 cities, ranging from about a dollar more per trip in Buffalo, Portland, and Salt Lake City to more than $10 more in Baltimore and San Jose. The average excess cost in the 16 regions was $5 per ride.
Operating Ratios
Revenues are not just a way of covering costs; they are a signal that someone is doing good work. Revenues greater than costs show that the users of goods or services believe that the private benefits they get outweigh the costs of providing those goods or services. Of course, in the long run they should be high enough to cover the capital costs as well.
To justify the tax support they receive, transit agencies claim that the public benefits of transit, whether environmental or social, justify those subsidies. Such claims should be easier to make if fares cover a large percentage of the costs.
Railroads typically calculate their operating ratios by dividing the revenues into the operating costs. When calculated this way, numbers less than one indicate profitability and the smaller the number the more profitable. I’m going to turn this around and divide the fare revenues by the operating costs. If the revenues are greater than the costs, the ratio will be greater than 1; if less than costs, the ratio will be less than one, and smaller numbers mean greater subsidies are required.
Two of the 110 agencies examined here actually produce more fare revenues than their operating costs. One is a private company, One Bus, that is owned by Coach USA and operates in Essex County, New Jersey. The other is the University of Georgia’s on-campus bus system. In both cases, fares covered between 110 and 120 percent of their operating costs.
Gainesville, Florida’s transit system was the next-best performer, earning 61 percent of its operating costs out of revenues. None of the other 108 agencies covered even half their operating costs from fares. Fares collected by more than half of the agencies covered less than 20 percent of their operating costs. At least a dozen, including the principal transit agencies in Houston, Kansas City, Raleigh, and Albuquerque, earned less than 10 percent of their operating costs in fares.
At least three agencies charge no fares at all and there is a movement pressuring other agencies to eliminate fares in the name of social justice. I think the case can be made to require that fares cover costs as I am skeptical that the environmental and social benefits of transit are any greater than for other forms of transportation.
Environmental Costs
Diesel buses are notorious energy consumers and polluters. While new technologies have reduced toxic air pollution, greenhouse gas emissions from Diesel engines remain high. Energy and emissions per passenger-mile can be reduced by attracting more passengers, using smaller buses, or using alternative fuels. Transit agencies appear to have given up on filling seats, but some are trying to reduce greenhouse gas emissions by using biodiesel, propone, or battery-powered buses.
In 2017, the most recent year for which data are available, the average car consumed less than 2,900 British thermal units (BTUs) per passenger-mile while the average light truck used less than 3,400 (and both were almost certainly less in 2019). That’s far better than the national average of transit buses, as both motor buses and trolley buses used more than 4,600 BTUs per passenger-mile.
Only two of the transit agencies considered here—San Francisco Muni and Honolulu—used significantly less energy than cars in their motor bus operations. Dayton’s trolley buses did as well, though as discussed below that number may be questionable. Motor buses operated by another dozen agencies, including New Jersey Transit and Denver’s RTD, used a little less energy than light trucks but more than cars.
The remaining agencies all used more energy per passenger-mile than automobiles. The worst cases were buses in Bakersfield and Sacramento, which used more than 9,000 BTUs per passenger-mile, and buses in Phoenix, Kansas City, Orange County, and a few smaller areas, which used more than 8,000. Albuquerque, Dallas, Nashville, Phoenix, Raleigh, and Reno are among those above 7,000, while Indianapolis, New Orleans, San Diego, and San Mateo County are above 6,000.
The record for greenhouse gases is similarly poor. The 2017 data show that the average car emits 204 grams of carbon dioxide and the average light truck 240 grams per passenger-mile. In comparison, the national average for motor buses is 350. Only two transit agencies, Honolulu and Dayton’s trolley buses, do better than the average car and only two more, San Francisco Muni and the University of Michigan’s campus buses, do better than the average light truck.
Most agencies produce more than 450 grams of carbon dioxide per passenger-mile and the worst, in Bakersfield and Sacramento, produce more than 700. Clearly, the environmental case for transit subsidies is bankrupt.
Honolulu and San Francisco do well because they fill a lot of seats: an average of 17 or more than twice the national average of 8. The University of Michigan uses smaller buses than most agencies.
I have to question the claimed energy efficiency of Dayton’s trolley buses because the other four cities that have trolley buses all consume more than 4,400 BTUs per passenger-mile even though they have greater average ridership—12 to 14 riders per bus vs. just 10 in Dayton. Dayton’s record has suspiciously improved from 2017, when it used about 4,000 BTUs per passenger-mile, to 2019, when it claimed to use only 2,000.
In 2017, most of Dayton’s trolley buses had been built by Skoda in 1998, plus it had a few built by Gillig in 2014. The fleet was the same in 2018, and the buses traveled almost exactly the same number of miles, yet reported kilowatt-hours declined by 25 percent. In 2019, Dayton acquired a few new Gillig buses, but they were delivered too late in the year to drive them more than a few thousand miles. Yet the reported kilowatt-hours per mile declined another 23 percent. The 2019 2019 transit data claims Dayton used one-third of the energy per vehicle-mile of the next-most efficient trolley bus operator, and I find that hard to believe.
San Francisco and Seattle trolley buses are energy hogs but do well on greenhouse gas emissions because so much of the electricity produced in those states comes from non-hydrocarbon sources. Boston and Philadelphia trolley buses are even more energy hogs and don’t do particularly well on greenhouse gas emissions because much of their electricity comes from burning fossil fuels.
Trips Per Capita
Another useful performance measure is the number of trips carried per resident of each urban area. Since many urban areas have more than one transit operator, I’m counting the total number of motor bus and trolley bus trips taken in each urban area.
Among the nation’s 100 largest urban areas, the highest is Honolulu at 75. San Francisco-Oakland comes in second at 64. Because most of its transit riders take the subway, New York is only number 3 at 56. Seattle is 39 and Baltimore, Chicago, Las Vegas, Los Angeles, Madison, Philadelphia, Pittsburgh, Portland, and Washington are clustered around 30.
At the other extreme is McAllen, Texas, whose buses carried only 1.8 trips per capita. San Juan, Puerto Rico is about 3.5; the region’s privately operated jitneys known as publicos carried twice as many passengers as buses.
Motor buses carried fewer than 10 trips per capita in 48 of the nation’s 100 largest urban areas including, among others, Dallas-Ft. Worth, Tampa-St. Petersburg, Sacramento, Cincinnati, and Indianapolis. Motor buses carried between 10 and 20 trips per capita in Miami, Houston, Atlanta, Phoenix, and 25 other urban areas in the top 100.
Among urban areas beyond the top 100, buses carried around 40 trips per capita in Ann Arbor, Davis, Durham, and Gainesville, Florida and around 30 in Lansing, Santa Barbara, and Santa Cruz, all university-dominated cities. In the vast majority of other regions they carried fewer than 10 trips per capita.
Honolulu transit does well partly because of high fuel prices, as gasoline there costs about a dollar more per gallon than the average on the mainland. If ever Congress repeals the Jones Act, Hawaiian gasoline prices will drop and transit ridership will follow.
Conclusions
Buses may be less expensive than most rail, but they still cost taxpayers a lot of money. The environmental justification for these subsidies is simply a lie, at least outside of Honolulu and San Francisco. The social justice justification is also questionable, especially considering (as pointed out in the previous policy brief) most of the taxes used to support transit are regressive and only 5 percent of low-income workers commute to work by transit.
The most disturbing finding of this analysis is the huge spread in costs and operating ratios among various transit agencies. Given their ability to draw upon taxpayer funds, transit managers appear to have little incentive to contain costs or to recover those costs out of fares, especially in bigger cities. As a result, their costs have risen to nonsensical levels. The movement to make transit free to riders will only give transit agencies another pass to waste more taxpayer dollars.
It is also disappointing that the Federal Transit Administration, which distributes more than $10 billion a year to transit agencies, has failed to ensure that those funds are cost-effectively spent, that is, that costs per vehicle mile or costs per rider are not significantly more in New York than in Lafayette. Instead, federal funds appear to be distributed based on the idea that everyone should have the option of riding transit.
That’s just an excuse, however; the real goal is to spread the money around so as many politicians and political constituencies as possible benefit and support continued funding in the long run. The only ones who are harmed are current and future taxpayers, and unfortunately, they rarely complain and when they do their objections are drowned out by the transit lobby.
In a larger view, the fact that the transit industry’s most-successful technology is 93 years old is one more indication that the industry is relying on a totally obsolete business model. The huge subsidies to transit have taken away any incentive for the industry to innovate and adapt to changing conditions. This is just another reason to end those subsidies.


_004a.jpg)
Roads suffer from obesity problems, just like people. When there are too many cars for the road network, you can reduce intake / move people to transit or let out the trousers / widen the roads.
“It is also disappointing that the Federal Transit Administration, which distributes more than $10 billion a year to transit agencies, has failed to ensure that those funds are cost-effectively spent….”
In a world where taxpayers are respected, FTA would conduct a review like the Antiplanner has done here (annually) and transit heads would roll.
FTA is more about promoting transit than protecting federal funds. Behind every transit boondoggle is the signature of an FTA official who thought it was a good idea…or who knew it wasn’t but, you know, social justice…or whatever….
Re: Lafayette, Indiana’s CityBus
“It spent $6.07 per vehicle-revenue mile operating its buses, the least of any agency that carried more than 5 million trips, and $76.02 per vehicle-revenue mile, the fourth-least of these agencies.”
Perhaps one of these should be “vehicle-revenue hour.”
I doubt we’ll ever know but it would be interesting to learn what Disney is spending for its buses at Disney World. Perhaps some day they’ll give us the numbers as a public service — a target for cities to work towards.
Proof this was never about providing transit, it was about building tax accessible infrastructure empires. Like the rail road tycoons of the 19th century
“Roads suffer from obesity problems, just like people. When there are too many cars for the road network, you can reduce intake / move people to transit or let out the trousers / widen the roads.”
Why don’t you stop lying? Outside of maybe one metro area in the US, transit has no appreciable effect on road congestion, except to increase it.
Randal, when I consider a new light rail line extension…for instance, the Orange line Max extension, I derive a much higher capital cost per passenger ride than you are deriving using your method of spreading the capital cost out over the entire light rail network. In the case of the Orange line, it’s capital cost is reportedly $1.3 billion back in 2016. If the social cost of capital is like 3% per year and you amortize this $1.3 billion over 30 years of debt repayment, you get an annual capital cost of about $66 million per year. The Orange line in the year 2019, using one quarter to extrapolate the whole year of ridership, maybe handles 3.7 million rides. Dividing $66 million by 3.7 million, results in a capital cost estimate of about between $17.50 and $18.00 per ride delivered by the Orange line. Maybe I should use, 50 years for life of line, but the way technology for automobiles is advancing; I wouldn’t count on fixed route light rail lines having much value at all out past 30 years from now, maybe even 20 years. Another interesting factoid, is a lot of the Max rides are like 2 to 3 miles in length; being concentrated within a few miles of down town Portland. When I argued in the County Voter Pamphlets against Metro’s recently proposed payroll tax to fund the SW Corridor Max extension…I argued in Clackamas and Washington County pamphlets that most of any benefit of light rail falls to the urban core of the City of Portland. I still think it is mostly for the government workers wanting to avoid the high cost of parking in down town Portland, and also, there is a side people mover to get people up to Pill Hill and the OHSU campus (also near down town Portland).
History of transportation technology: FIRSTS
– Streetcar: HOrsedrawn 1804,
– Steam Streetcar: 1883
– Cable driven: 1873
– Electric: 1881
First Automobile: 1886