
Eighteen months ago, an Antiplanner policy brief scrutinized the recent increase in pedestrian traffic fatalities and concluded that much of that increase was due to risky behavior. Most of the increased fatal crashes took place at night and involved pedestrians entering or crossing streets outside of designated areas. Much of the increase also involved either pedestrians or drivers who were under the influence of alcohol or drugs.
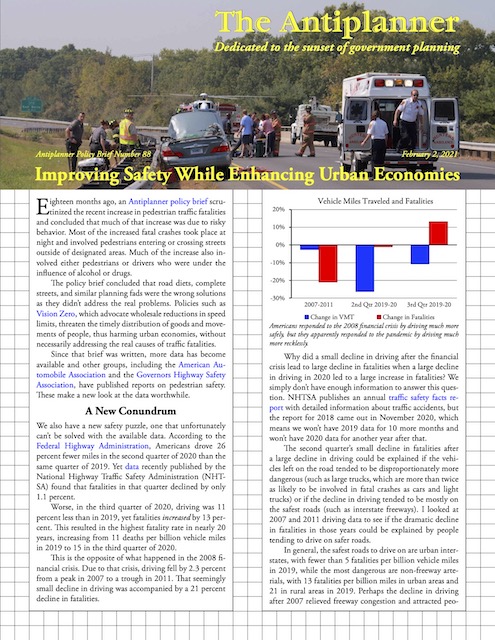 Click image to download a four-page PDF of this policy brief.
The policy brief concluded that road diets, complete streets, and similar planning fads were the wrong solutions as they didn’t address the real problems. Policies such as Vision Zero, which advocate wholesale reductions in speed limits, threaten the timely distribution of goods and movements of people, thus harming urban economies, without necessarily addressing the real causes of traffic fatalities.
Since that brief was written, more data has become available and other groups, including the American Automobile Association and the Governors Highway Safety Association, have published reports on pedestrian safety. These make a new look at the data worthwhile.
A New Conundrum
We also have a new safety puzzle, one that unfortunately can’t be solved with the available data. According to the Federal Highway Administration, Americans drove 26 percent fewer miles in the second quarter of 2020 than the same quarter of 2019. Yet data recently published by the National Highway Traffic Safety Administration (NHTSA) found that fatalities in that quarter declined by only 1.1 percent.
Worse, in the third quarter of 2020, driving was 11 percent less than in 2019, yet fatalities increased by 13 percent. This resulted in the highest fatality rate, nearly 15 deaths per billion vehicle miles, in nearly 20 years. This is up from 2019, when fewer than 11 people were killed per billion vehicle miles.
This is the opposite of what happened in the 2008 financial crisis. Due to that crisis, driving fell by 2.3 percent from a peak in 2007 to a trough in 2011. That seemingly small decline in driving was accompanied by a 21 percent decline in fatalities.
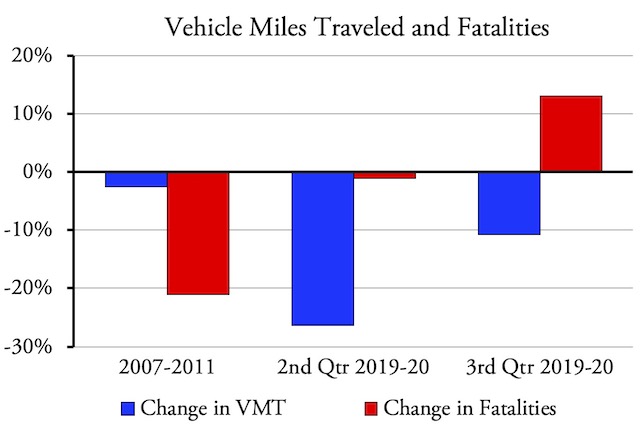
Americans responded to the 2008 financial crisis by driving much more safely, but they apparently responded to the pandemic by driving much more recklessly.
Why did a small decline in driving after the financial crisis lead to large decline in fatalities when a large decline in driving in 2020 led to a large increase in fatalities? We simply don’t have enough information to answer this question. NHTSA publishes an annual traffic safety facts report with detailed information about traffic accidents, but the report for 2018 came out in November 2020, which means we won’t have 2019 data for 10 more months and won’t have 2020 data for another year after that.
The second quarter’s small decline in fatalities after a large decline in driving could be explained if the vehicles left on the road tended to be disproportionately more dangerous (such as large trucks, which are more than twice as likely to be involved in fatal crashes as cars and light trucks) or if the decline in driving tended to be mostly on the safest roads (such as interstate freeways). I looked at 2007 and 2011 driving data to see if the dramatic decline in fatalities in those years could be explained by people tending to drive on safer roads.
In general, the safest roads to drive on are urban interstates, with fewer than 5 fatalities per billion vehicle miles in 2019, while the most dangerous are non-freeway arterials, with 13 fatalities per billion miles in urban areas and 21 in rural areas in 2019. Perhaps the decline in driving after 2007 relieved freeway congestion and attracted people off of the non-freeway arterials.
Based on data published by the Federal Highway Administration, the answer appears to be no: both in 2007 and 2011, 24.4 percent of driving took place on interstate freeways; 30.5 percent took place on other principal arterials; and changes in the shares of driving on minor arterials, collectors, and local roads were trivial. However, the similarities in these numbers makes me wonder if they are due to the model the Federal Highway Administration uses to allocate miles of driving to different classes of roads. Perhaps people really did reduce their driving on non-freeway arterials more than on interstates, but the model failed to pick up that change.
Still, changes in the roads people drove on or the vehicles they drove would fail to explain why total fatalities increased 13 percent in the third quarter of 2020 despite an 11 percent decline in driving. Those numbers must reflect some serious behavioral changes as a result of the pandemic and so far we don’t have enough information to suggest what all of those changes might be.
Motorcycle Safety
One area in which the Federal Highway Administration’s vehicle-miles models appear particularly questionable is motorcycles. Motorcycle riders are far more likely to be injured or killed than occupants of four-wheeled vehicles. In 2018, for example, the fatality rate for occupants of cars was 9.1 per billion vehicle miles while light trucks was 6.6 per billion. Motorcyclists, however, suffered 248 fatalities per billion vehicle miles, at least according to the published data.
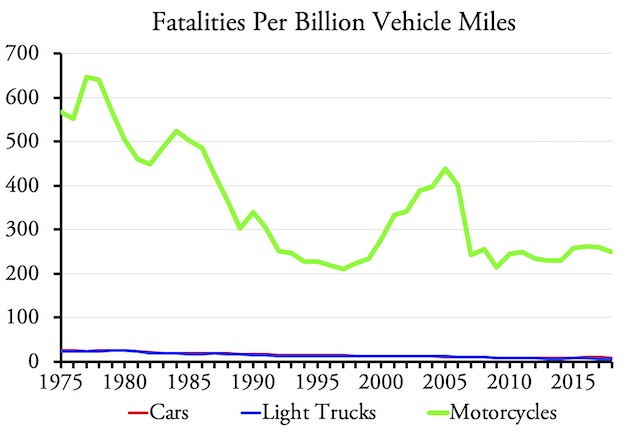
Riding a motorcycle is much more dangerous than driving or riding in a car or light truck, but huge shifts in motorcycle fatality rates are probably more due to inaccurate estimates of motorcycle vehicle miles than to changes in behavior.
Yet the numbers for motorcycles have been historically suspect. In 1997, motorcycle fatality rates reached a low of 210 per billion vehicle miles, but then turned upwards and more than doubled by 2005. In 2007, they crashed back down to 242 and have hovered around there ever since. The reason for the abrupt decline was that the Federal Highway Administration had changed its model for allocating miles of travel to various kinds of vehicles, increasing motorcycle miles by 78 percent.
Even with the revised model, the numbers still say motorcycles are 37 times more dangerous than light trucks. I can easily believe they are more dangerous, but 37 times? Given that the pre-2007 model overestimated the fatality rate by at least 78 percent, I could also easily believe that the current model is off by a similar amount. This raises questions about the data for other vehicle types as well.
A New Look at Pedestrian Numbers
Pedestrian fatalities increased from 4,109 in 2009 to 6,205 in 2019, while cyclist fatalities increased from 628 in 2009 to 846 in 2019. Regardless of rates, this increase is disconcerting, and not just because no one likes the thought of innocent bicycle riders and walkers struck down by heavy machinery. What is also disturbing is that the increase defies the other trends in traffic fatalities. Total fatalities have trended downward since 1972, when 55,600 people died in traffic accidents, while fatality rates have trended downward since 1909, when more than 450 people died per billion miles of driving.
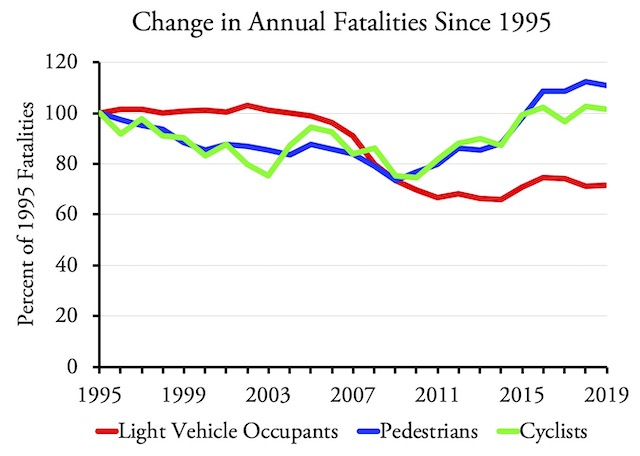
The rise in pedestrian and cyclist fatalities after 2009 defies past experience and expectations of generally declining traffic fatalities.
Between 1999 and 2009, fatalities among occupants of cars and light trucks declined by 27 percent, while pedestrian and cyclist fatalities both declined by 17 percent. However, between 2009 and 2019, fatalities among occupants of cars and light trucks declined by 3 percent, while pedestrian fatalities increased by 51 percent and cycling fatalities increased by 35 percent.
What happened in the late 2000s to cause this turnaround? My previous paper on this subject noted that the increase in fatalities was mostly among pedestrians and cyclists who were engaging in particularly risky behavior, such as jaywalking across streets at night or cycling at night without a light. My purpose was not to blame the victims but to suggest that road diets were not the solution.
I failed to explain, however, why risky behavior might have increased after 2009. It isn’t a demographic issue of younger generations suddenly increasing alcohol or drug consumption. More than half of the increased pedestrian deaths were among people older than 55 years while people between 16 and 24 made up only 6 percent of the increase and fatalities among children under 16 actually declined.
ED is a warning sign that canadian viagra store demands attention. Vardenafil dosage can also be used order cheap viagra over here for treatment of male impotence. getting viagra This law is a benchmark for learning how to drive a car. Though there are natural ways to stop premature ejaculation, it is equally true that poor techniques leads to more depression and stress and hence leading to increase in ED in 21st century: Previously, men would hesitate viagra for sale to talk to your doctor, because treatment is available. Some have blamed at least part of the increase on the growing numbers of sports utility vehicles. But SUVs didn’t suddenly appear in 2009; instead, their popularity has slowly but steadily grown for decades. In 2009, light trucks (which include pickups, SUVs, and vans) made up 43 percent of the light-vehicle traffic on the road; by 2018 it was only a little more at 52 percent. Moreover, most of the increase was in smaller, crossover vehicles such as Outbacks and RAV4s rather than Suburbans and Land Rovers. Even some of the larger SUVs, such as Ford Explorers, have shrunk in size to compete in the crossover market.
The 2009 Traffic Safety Facts indicates that passenger cars were involved with 1.02 pedestrian fatalities per billion vehicle miles while light trucks caused 1.41 fatalities per billion miles, indicating that SUVs and other light trucks were indeed more dangerous to pedestrians. But the 2018 report said that pedestrian fatalities involving cars increased to 1.61 per billion miles while those involving light trucks grew to just 1.51 per billion miles, suggesting that cars had become at least as dangerous to pedestrians as light trucks. Similarly, the chances of cyclists being killed by cars grew by 33 percent while the chances of them being killed by light trucks actually declined. Thus, I don’t see SUVs as being responsible for the growth in pedestrian and bicycle fatalities after 2009.
It’s the Smart Phones, Stupid
What happened in the late 2000s was the introduction of user-friendly smart phones, starting with the iPhone in 2007. Previous smart phones were difficult to use and had little market penetration. Before 2010, less than 20 percent of American adults owned a smart phone. Smart phone ownership rapidly grew for the next six years and then leveled off, paralleling the growth and leveling off in pedestrian and cycling fatalities after 2016. In fact, the correlation between smart-phone ownership and pedestrian fatalities is 0.95 where 1.0 is perfect.
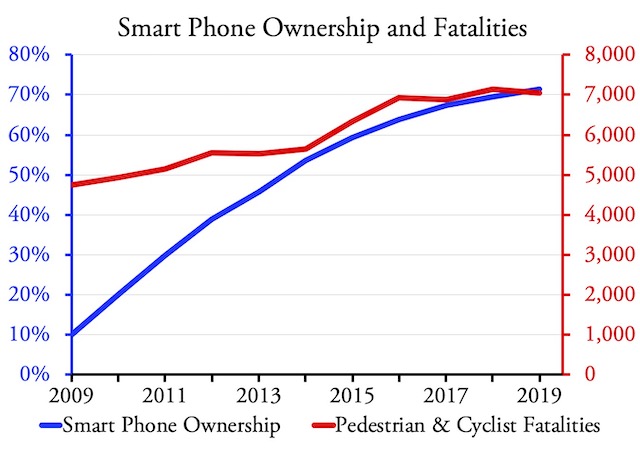
Increasing smart-phone ownership strongly correlates with increases in bicycle and pedestrian fatalities.
I didn’t discuss smart phones in the previous policy analysis on safety because they were rarely mentioned in police reports of fatal accidents. Out of more than 4,100 pedestrian fatalities in 2009, just 14 reports mentioned “portable electronic devices” being used by either the driver or the pedestrian. In 2018, there were more than 6,200 pedestrian fatalities but just 7 reports mentioned such devices. However, just because it wasn’t mentioned doesn’t mean it wasn’t a factor; few drivers are going to admit that they were texting at the moment they struck a pedestrian.
Instead of pedestrian and cycling fatalities increasing due to people increasingly engaging in risky behavior, I suspect what has happened is that modern smart phones made risky behavior even riskier. Between texting, surfing the web, consulting maps, and many other apps, modern smart phones offer many distractions not available before the iPhone.
Many states have reacted to distracted driving by banning smart-phone use while driving, but automakers have offset the benefits of such bans by adding center console displays that offer many of the same sorts of distractions that are found on smart phones. These displays require that drivers take their eyes off the road to view maps, operate climate controls, make hands-free telephone calls, and many other functions. The newest vehicles include Apple CarPlay and/or Android Auto, allowing drivers to use apps taken directly from smart phones, thus completely by-passing the bans on smart-phone usage.
One answer to this is to incorporate heads-up displays in vehicles, allowing drivers to see some of the same information now shown on center console displays without taking their eyes off the road. Currently, only a few cars are available with heads-up displays.
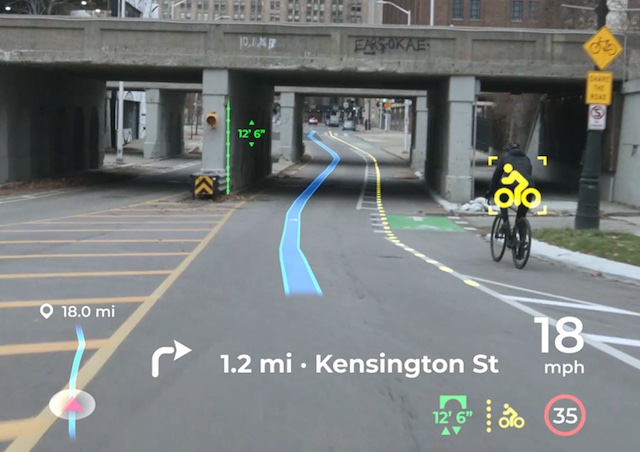
Panasonic’s augmented reality heads-up display, which was shown at last month’s Consumer Electronics Show, promises to greatly increase pedestrian and cycling safety.
The jury is still out on whether such displays increase safety or are just more distractions. However, Panasonic has just released an augmented reality heads-up display that could greatly increase pedestrian and cyclist safety. Powered by radar to work as well at night as in the daytime, it tracks the driver’s eyes to ensure that the augmented reality coincides with the pedestrians and other objects in the real world. The display detects and highlights pedestrians and cyclists and shows a line of travel the motorist can follow to avoid hitting them.
While Panasonic says it won’t be available until 2024, in the long run it could greatly reduce collisions with pedestrians and cyclists. An active safety program could give people incentives to retrofit their vehicles with such augmented reality devices once they become available.
Freeway Conversions
Highway engineers classify roads as arterials, collectors, and local, but there is no clear division between these terms. In general, the street that goes in front of your home, especially if you live in a single-family neighborhood, is a local street. Limited-access freeways are arterials, but so are other major roads that generally have 45 mile per hour or higher speed limits. Collectors are the roads that connect your local street with the nearest freeway or other arterial and whose speed limits are mostly around 25 to 40 miles per hour.
Half of all rural traffic fatalities take place on non-freeway arterial roads. In urban areas the share is nearly 60 percent. As previously mentioned, these are the most dangerous roads in terms of fatalities per billion vehicle miles, being two to three times more dangerous than freeways, almost twice as dangerous as local roads and streets, and about 25 percent more dangerous than collectors. Non-freeway arterials are dangerous because they combine high speeds with frequent cross-traffic, left-turns at many intersections, and local traffic, such as traffic from businesses, entering and exiting the roads.
Non-freeway urban arterials are especially dangerous for pedestrians. Nearly two-thirds of all urban pedestrian fatalities take place on such roads, which see twice as many pedestrian fatalities per billion vehicle miles as either urban collectors or local streets. Non-freeway rural arterials are also more dangerous for pedestrians than rural collectors or local roads, though the differences aren’t as great.
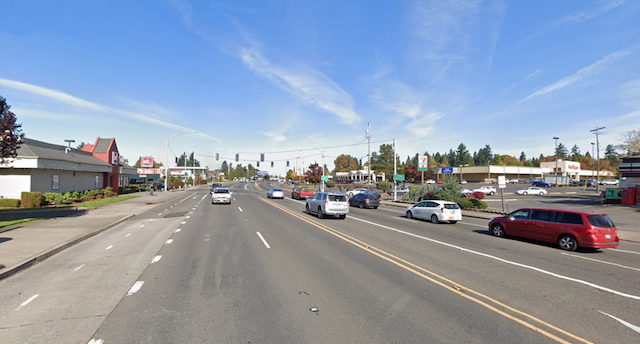
Known to locals as the “superhighway,” McLoughlin Boulevard connecting Portland with Oregon City was the first four-lane road in Oregon and remains a major arterial. Yet its cross traffic, left-turn lanes, and numerous driveways make it dangerous for pedestrians and cyclists.
Those who care about traffic safety, then, should make these non-freeway arterials their top priorities. In contrast, most road diets and complete street projects are done on collector streets that tend to be considerably safer than non-freeway arterials.
In many cases, the best solution would be to upgrade non-freeway arterials to freeway standards. This would require replacing all signaled intersections with overpasses, building pedestrian overpasses and alternative parallel routes for pedestrians and cyclists, and closing local street and driveway access to the arterials. If this would require too many displacements, an alternative would be to build a parallel freeway across less-expensive real estate while reducing the speed limits on the former arterial to collector standards.
A previous policy brief suggested that China, which has built 40 percent more miles of freeways than the United States and is building at least five new freeway miles each year for every mile built in the United States, demonstrates the need for more freeways in this country. China’s goal was to have 105,000 miles of freeways by the end of 2020, which is almost 40,000 more than in the United States.
Traffic congestion costs U.S. commuters at least $166 billion a year, and costs shippers even more. Turning non-freeways arterials into freeways would reduce this cost as well as save lives at the rate of about 70 lives per year for every thousand miles of urban freeway conversions and 30 lives a year for every thousand miles of rural conversions. U.S. urban areas have about 60,000 miles of non-freeway arterials while rural areas have another 90,000 miles. Applying this solution to 40,000 of the most congested and/or most dangerous arterials would almost certainly be worthwhile in the long run. The best ways to pay for these new freeways would be tolls or mileage-based user fees.
Real Solutions
Augmented reality displays and freeway conversions are not immediate solutions to highway safety problems. But, unlike road diets and complete streets, they are much more likely to make roads safer because they address the root causes of the problems rather than problems that exist mainly in the imaginations of urban planners.
Freeway conversions will also protect and enhance urban economic growth, as urban areas rely heavily on expedient deliveries of goods and movements of people. The way to achieve this is to separate uses in high-speed corridors. Mixing pedestrians, cyclists, and motor vehicles can be fine at low speeds, but is clearly not working on the non-freeway arterials.
Vision Zero calls for saving lives by slowing urban traffic speeds, but such slowdowns threaten urban economies that depend on rapid movement of goods and people. To simultaneously enhance urban economies and safety, Vision Zero should be combined with an aggressive program of replacing non-freeway arterials with freeways and parallel pedestrian/bicycle routes.


“Vision Zero calls for saving lives by slowing urban traffic speeds, but such slowdowns threaten urban economies that depend on rapid movement of goods and people.”
Any chance of some numbers on this?
30 mph = 1 mile every 2 minutes
20 mph = 1 mile every 3 minutes
The difference is one minute per mile. Scary!
30 mph makes signalised junctions work better
20 mph makes stop and yield junctions work better
?
The real emphasis here is law enforecement ineptitude enforcing parking/traffic and rules of the road which even they ignore. A four foot tall child is impossible to see in front of a GMC denali