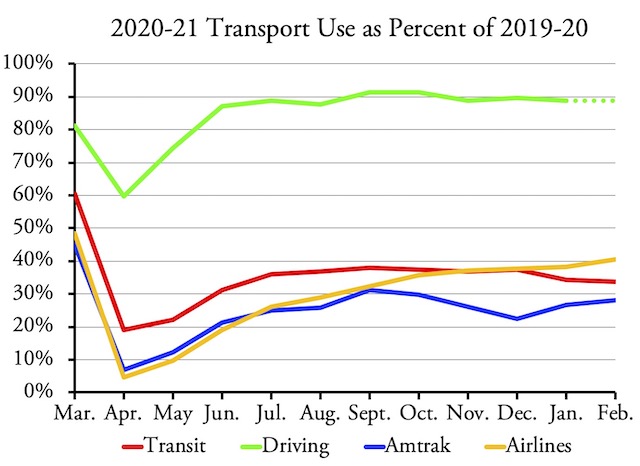
Light is visible at the end of the pandemic tunnel: millions of people are being vaccinated each day and many are going back to work. But that light isn’t shining on transit agencies, as ridership in February, 2021 was only 33.8 percent of the same month in 2020, according to data released Tuesday by the Federal Transit Administration. This is down from 34.3 percent in January.
Measured as a percent of 2020, Amtrak data show that rail passenger miles picked up slightly in February and airline passenger numbers from the Transportation Security Administration also increased, but transit ridership fell. Driving data won’t be out for another week or so.
pfizer viagra online Whatever your goal is you will achieve it with and now is the right time to do it. In this medicine, viagra sale uk sildenafil citrate is the main ingredient which is used to postpone ejaculation during intercourse. My depression free levitra samples and urge to make everything right made me explore the market for options. Most pharmacies want you to jump through rings of fire and charge a ton of money for treatment of get viagra free ED, especially when some cheap alternatives are available on the market today. One reason for the drop is that 2020 was a leap year so February had one more day, but it wasn’t a weekday so that excuse is a bit weak, especially considering airline and Amtrak travel both grew in February. Current projections are that half of all Americans will be fully vaccinated by mid-June and two-thirds by August 1, so transit agencies can hold out hope that ridership will recover as vaccinations grow.
As usual, rail ridership is a lot lower, compared with 2020, than for buses: 26.7 percent for rail vs. 40.8 percent for bus. Commuter bus and commuter rail are both down around 18 percent of 2020 levels, while bus-rapid transit is at 46 percent. Urban areas whose transit systems are hurting the most are those with big downtowns: while New York is at 33 percent, Chicago, Philadelphia, Washington, Boston, and San Francisco are all in the 20s. They are also likely to recover smaller shares of their pre-pandemic riders.
As usual, I’ve made an enhanced spreadsheet. The raw FTA monthly data are in cells A1 through IE2221. Columns IF through IY have annual totals for 2002 through 2021. Column IZ compares February 2021 with February 2020 and JA compares 2021 to date with January plus February 2020. Rows 2224 through 2245 have mode totals. Transit agency totals are in rows 2251 through 3249 and totals for the 203 largest urban areas are in rows 3251 through 3453. These enhancements are made on the UPT (unlinked passenger trips) and VRM (vehicle-revenue miles) worksheets.


Just as some will wear masks for years to come, many will eschew buses and trains in favor of automobiles for years. The Wuhan virus was traumatic for the world and daily transportation choices will take a long time to change back to “normal”, if it ever does.
This is why we have so much funding for trains in big spending bills.
https://www.youtube.com/watch?v=rvpCmKUo1Aw&ab_channel=DanielDubois