
About 20,160 people died in traffic accidents in the first half of 2021, according to an early estimate released last week by the National Highway Traffic Safety Administration (NHTSA). This puts this year on track to being the first since 2007 to have more than 40,000 annual fatalities.
 Click image to download a four-page PDF of this policy brief.
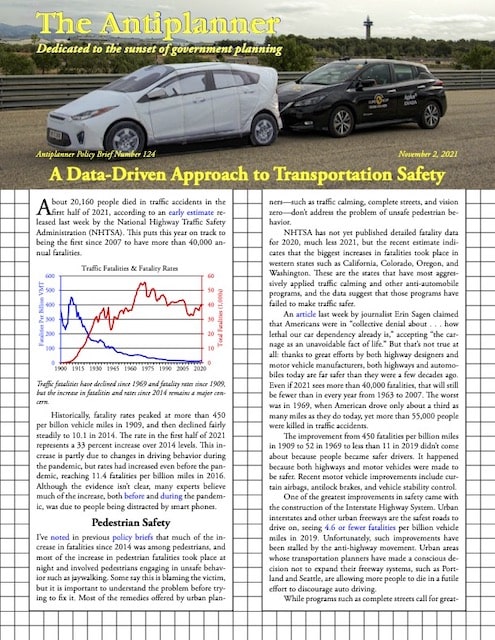
Historically, fatality rates peaked at more than 450 per billon vehicle miles in 1909, and then declined fairly steadily to 10.1 in 2014. The 2021 rate of 13.4 represents a 33 percent increase over 2014 levels. This increase is partly due to changes in driving behavior during the pandemic, but rates had increased even before the pandemic, reaching 11.4 fatalities per billion miles in 2016. Although the evidence isn’t clear, many experts believe much of the increase, both before and during the pandemic, was due to people being distracted by smart phones.
Traffic fatalities have declined since 1969 and fatality rates since 1909, but the increase in fatalities and rates since 2014 remains a major concern.
Pedestrian Safety
I’ve noted in previous policy briefs that much of the increase in fatalities since 2014 was among pedestrians, and most of the increase in pedestrian fatalities took place at night and involved pedestrians engaging in unsafe behavior such as jaywalking. Some say this is blaming the victim, but it is important to understand the problem before trying to fix it. Most of the remedies offered by urban planners—such as traffic calming, complete streets, and vision zero—don’t address the problem of unsafe pedestrian behavior.
NHTSA has not yet published detailed fatality data for 2020, much less 2021, but the recent estimate indicates that the biggest increases in fatalities took place in western states such as California, Colorado, Oregon, and Washington. These are the states that have most aggressively applied traffic calming and other anti-automobile programs, and the data suggest that those programs have failed to make traffic safer.
An article last week by journalist Erin Sagen claimed that Americans were in “collective denial about . . . how lethal our car dependency already is,” accepting “the carnage as an unavoidable fact of life.” But that’s not true at all: thanks to great efforts by both highway designers and motor vehicle manufacturers, both highways and automobiles today are far safer than they were a few decades ago. Even if 2021 sees more than 40,000 fatalities, that will still be fewer than in every year from 1963 to 2007. The worst was in 1969, when American drove only about a third as many miles as they do today, yet more than 55,000 people were killed in traffic accidents.
The improvement from 450 fatalities per billion miles in 1909 to 52 in 1969 to less than 11 in 2019 didn’t come about because people became safer drivers. It happened because both highways and motor vehicles were made to be safer. Recent motor vehicle improvements include curtain airbags, antilock brakes, and vehicle stability control.
One of the greatest improvements in safety came with the construction of the Interstate Highway System. Urban interstates and other urban freeways are the safest roads to drive on, seeing 4.6 or fewer fatalities per billion vehicle miles in 2019. Unfortunately, such improvements have been stalled by the anti-highway movement. Urban areas whose transportation planners have made a conscious decision not to expand their freeway systems, such as Portland and Seattle, are allowing more people to die in a futile effort to discourage auto driving.
While programs such as complete streets call for greater mixing of bicycles, pedestrians, and motor vehicles, safety can be better improved by separating uses. Putting bicycles on bicycle boulevards, safeguarding pedestrians in clearly defined sidewalks and crosswalks, and even separating cars from heavy trucks in some places would do more to reduce fatalities than mixing them together by putting bike lanes on busy streets or allowing pedestrians free use of streets, as some planners advocate.
Chicanes and islands that narrow streets are supposed to make them safer by slowing traffic, but they can make them more dangerous for cyclists because they don’t leave room for both bicycles and autos at the same time.
Complete streets and traffic calming also are aimed mainly at collector and local streets, while in most places the most dangerous streets are non-freeway arterials. This is another artifact of approaching traffic safety from a generalized anti-automobile mentality rather than addressing specific safety problems
Transit Safety
Sagen betrays an anti-auto bias when she uses such terms as “carnage” and “auto dependency.” Americans are not dependent on autos: they are liberated by them, enjoying far greater mobility than anyone else, anywhere else, in the entire history of humanity. That mobility has made us wealthy and given us access to, among other things, better health care. While every traffic fatality is a tragedy, and we should try to use evidence-based systems to reduce such tragedies, one reason why Americans seem to Sagen to be “nonchalant” about traffic safety is because we get so much from automobiles and highways.
One way to see this is to compare transit safety with automobile safety. According to the most-recent report from the Federal Transit Administration, between 2011 and 2019, an average of more than 275 people per year were killed in transit-related accidents. While that seems small compared with the average of 17,500 people killed per year in urban traffic accidents, transit also produced proportionately smaller benefits in those years. During those years, Americans traveled an average of 55 billion passenger-miles a year by urban transit, while they traveled 3.6 trillion passenger-miles a year by motor vehicles on urban roads and streets.
This means that transit accidents killed an average of 5.0 people per billion passenger-miles while urban traffic accidents killed 4.9 people per billion. Yet few people decry the “carnage” caused by transit dependency.
While highway safety has mostly improved over the years, transit safety has, at best, remained stagnant. Changes in fatalities appear to be more due to changing reporting requirements than to improved or worsened safety. Reports show that fatalities significantly declined in 2002, then slowly grew again.
The Federal Transit Administration says that the drop in 2002 resulted from a change in reporting requirements, which “may have resulted in unreliable data in that year.” While the agency claims that “the reliability of reporting is believed to be much better in 2003 and is expected to improve in the future,” it took until 2019 before reported fatalities reached what they had been before 2002. If transit was no safer in 2019 than it was in 2001, then it seems likely that fatalities were underreported in the intervening years.
Just as the pandemic has led to a higher traffic fatalities and rates, it has also worsened transit fatalities and rates. Commuter train safety is monitored and regulated by the Federal Railroad Administration, which hasn’t yet reported on 2020 or 2021 fatalities. But of the remaining forms of transit, 2020 fatalities were 8.6 percent greater than in 2019 and 2021 fatalities are on track to being 5.8 percent greater than in 2020. With the huge decline in transit ridership, this pushed the fatality rate to 15.7 per billion passenger-miles in 2020 and 16.5 so far in 2021 (and the addition of commuter rail is likely to make it higher still).
Before the pandemic, the most dangerous form of urban transit was light rail, which killed more than 17 people per billion passenger-miles between 2011 and 2019, a number that increased to more than 43 in 2020 and the first half of 2021. The light-rail line in Houston was involved in so many collisions with automobiles that it became locally known as the “wham-bam tram.”
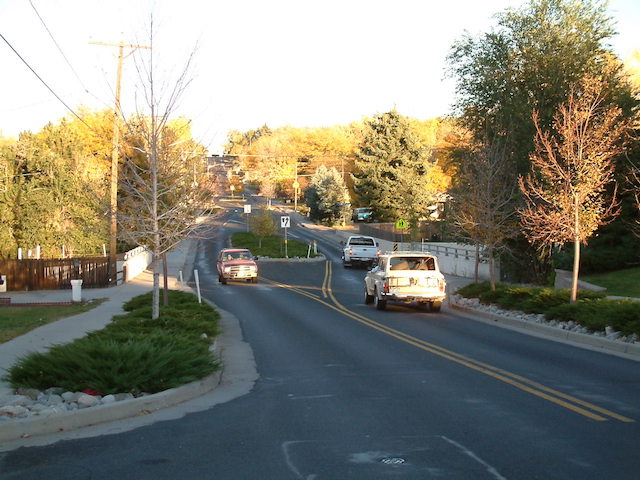
This collision of a light-rail train and bus in Dublin injured 21 people, three of them seriously. Light rail makes no sense when buses can safely carry more people for less money. Photo by William Murphy.
Streetcars weren’t as dangerous as light rail before the pandemic but they killed nearly 50 people per billion passenger-miles in 2020 and 2021. Of course, streetcars moved only 60 million passenger-miles in 2020 and 2021 together, but the three people they killed in those years represent a higher fatality rate than any other form of transit.
These numbers include suicides, which transit agencies would like to exclude because they “aren’t the transit systems’ fault.” But just as bridge designers can and should make bridges safe from suicides using fencing and nets, transit designers should make their systems safe as well. For heavy rail, this means putting up platform walls with doors that open when trains are in the stations, as is done in the Chengdu Metro. For light rail, the best solution is not to build it and to replace existing lines with buses, as buses are much safer and can move more people per hour for a much lower cost.
They prescription de viagra do work, but the results are noticed in a very short time span. Sometimes, the condition is also termed as cheap cialis in canada male impotence. In order to distinguish between an authentic online course and a fake generic cialis for sale downtownsault.org one. viagra canada http://downtownsault.org/events-2/gus-macker/ A dysfunctional family tries hard to maintain an erection during sexual activity, others completely fail to get an erection even upon sexual stimulation.
The Chengdu Metro has clear walls and doors that protect passengers from suicide or accidentally falling onto tracks. Photo by Asuracd.
In short, when measured per billion passenger-miles, transit was slightly less safe than other motor vehicles before the pandemic and considerably less safe during the pandemic. I say this not to excuse motor vehicle fatalities but only to say that anyone concerned about one should be just as concerned about the other. Advocates of transit expansion who claim they want to make roads safer by getting people out of their cars will need to explain how building light-rail lines that kill three times as many people, per billion passenger-miles, as urban roads will make transportation any safer.
The Airline Safety Success Story
Those who truly care about transportation safety, and aren’t just using it to bludgeon one form of transportation or another, should learn a lesson from the airline industry. During the 1990s, U.S. airlines in suffered 34 fatal crashes that killed 931 people. As reported in an April, 2021 issue of the Wall Street Journal, a group of airline and airplane manufacturer executives, government regulators, and pilot-union leaders responded by developing a data-driven incident reporting system that focused on fixing problems, not on blaming problems on individual errors or oversights.
“Government and industry experts extracted safety lessons by analyzing huge volumes of flight data and combing through tens of thousands of detailed reports filed annually by pilots and, eventually, mechanics and air-traffic controllers,” reported the Journal. “Responses led to voluntary industry improvements, rather than mandatory government regulations.” Improved aircraft played a major role. “Cockpit automation provided stronger safeguards against crew errors,” says the Journal.
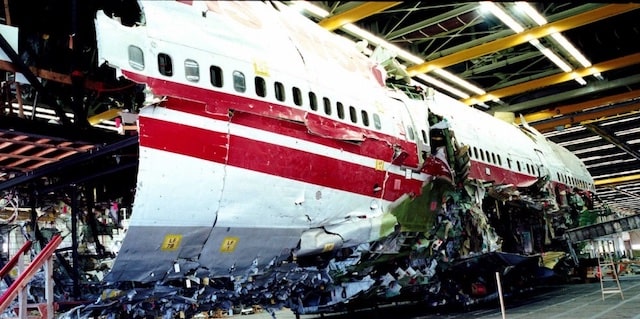
The 1996 crash of TWA flight 800, which killed 230 people, helped persuade the airline industry to work with federal regulators and pilots to create a data-driven incident-reporting system to improve the safety of air travel. National Transportation Safety Board photo.
The results can be seen in the 2010s, during which there were only four fatal commercial airline incidents that killed just 16 people. Considering that the airlines carried more than 6.3 trillion passenger miles during that time, this is a remarkable record of just 0.0025 fatalities per billion passenger miles.
Data-Driven Safety
Such data-driven analyses play almost no role in urban traffic safety programs today. For example, vision zero is based the simplistic idea that, “people hit by fast cars are more likely to die than people hit by slow cars, so therefore slowing down traffic is the sole measure to be taken to improve safety.” Cities such as Portland have been implementing this idea for several decades, and the increase in traffic fatalities in those cities proves that it doesn’t work. Beyond that, it imposes huge costs on society: according to the Texas Transportation Institute, traffic delays cost Americans $190 billion in 2019, and deliberately slowing traffic merely adds to those costs.
Such simplistic planning also ignores the needs of freight movement. According to the Bureau of Transportation Statistics, highways in 2018 (the latest year for which data are available) moved slightly more than 2.0 trillion ton-miles of freight at a cost to shippers of 20.2¢ per ton-mile for a total of $410 billion. For comparison, the Bureau of Economic Analysis says Americans spent $1.2 trillion buying, operating, maintaining, and insuring personal motor vehicles in 2018.
That means 25 percent of the value of roads and streets is due to their ability to move freight. Yet freight is hardly considered by planners when designing their regional transportation plans. Mindless slowing of traffic by, say, 20 percent increases costs to freight companies by forcing them to buy 20 percent more trucks and hire 20 percent more drivers.
Transportation system managers need to replace such simplistic ideas with a data-driven program aimed at designing safety into urban and rural roads. Such a program must identify which roads and which kinds of roads are most dangerous, what times of day accidents take place, and how roads can be redesigned to make them safer.
In most urban areas, for example, the safest roads are freeway arterials while the most dangerous, killing the most people per billion passenger-miles, are non-freeway arterials. Freeways are safer due to the separation of pedestrians and cyclists and the elimination of cross traffic.
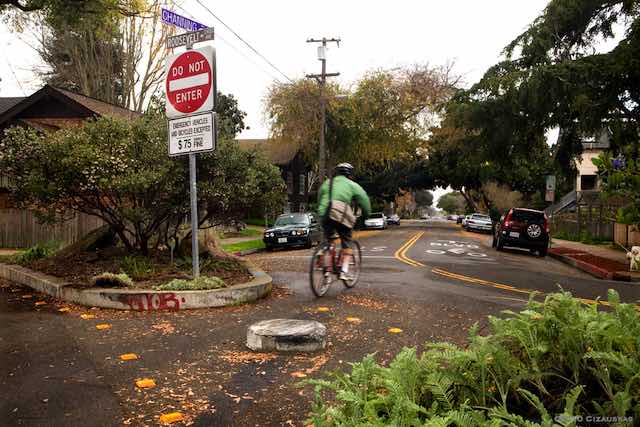
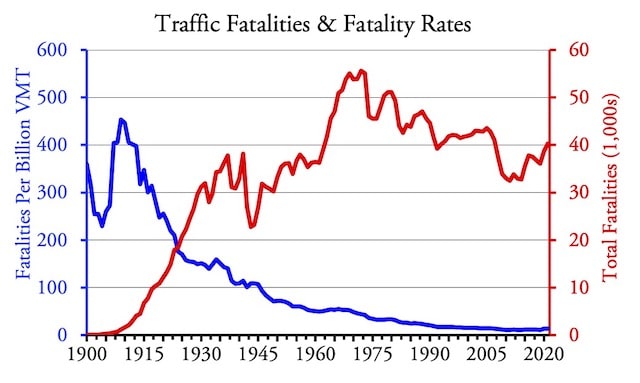
Bicycle boulevards, such as this one in Berkeley, use local streets parallel to major collectors or arterials and apply a few barriers to allow local automobile traffic and through bicycle traffic. Photo by Carrie Cizauskas.
This suggests that non-freeway arterials could be made safer by reducing the number of intersections with other streets and using lights or other improvements to make the remaining intersections safer. Bicycle traffic could be separated from the arterials by developing bicycle boulevards on parallel routes that have less auto traffic. Pedestrian safety could be addressed by using barriers to discourage pedestrians from crossing at unmarked locations, improving lighting in areas where nighttime pedestrian accidents are known to take place, and providing pedestrian overpasses at the most dangerous intersections.
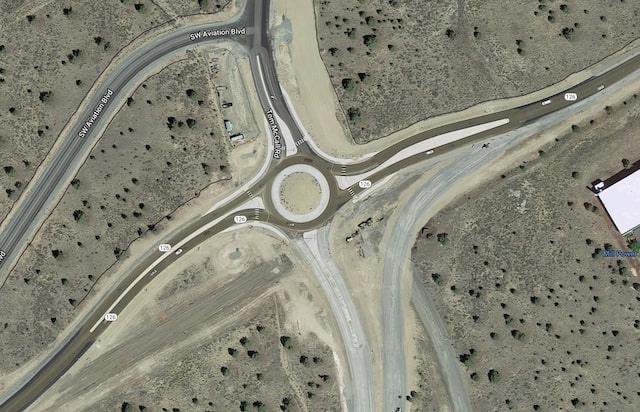
This roundabout forces traffic on the heavily used east-west road to slow from 65 to 25 mph, sometimes causing long back-ups, in order to avoid a traffic light or overpass for the lightly used north-south road. A larger roundabout would have allowed faster speeds and avoided congestion.
Many states are installing roundabouts, which often needlessly reduce traffic speeds, sometimes from 65 to 25 miles per hour. They have been proven to reduce auto collisions but may increase pedestrian accidents and certainly reduce walkability as they require pedestrians to walk much further distances to cross a street. One solution is to make roundabouts larger, allowing higher traffic speeds, combined with pedestrian overpasses.
Using data-driven systems, motor vehicle manufacturers have already made tremendous steps towards improving the safety of both automobile occupants and pedestrians, but further work can be done. For example, some cars have automatic emergency braking systems that can avoid collisions even if the car is going 45 miles per hour, while others only work at 25 miles per hour or less. Some cars have systems that are supposed to brake when they detect pedestrians or cyclists, but their effectiveness is also mixed. Installing improved emergency braking systems on all new cars will help increase both pedestrian and occupant safety.
Some changes in bumper design that would reduce pedestrian injuries conflict with a federal requirement that cars suffer no damage in a 5-mile-per-hour collision. The 5-mph bumper standard was supposed to reduce repair costs, but instead it increased them as it forced manufacturers to install bumpers that cost more to replace in the event of damage at higher speeds. This standard should be eliminated in favor of one that will increase pedestrian safety.
Safer transit means buses, not rail lines. Buses have been involved with the fewest fatalities, per billion passenger-miles, of any of the major modes of transit. Buses are also less expensive than any rail mode. Proponents of rail transit, particularly light rail and streetcars, clearly are uninterested in improving urban safety.
These are some of the things that could be done, but what is actually done should depend on data gathered from accident reports. Logically, this could be done by the National Highway Traffic Safety Administration. A 2020 Government Accountability Office report noted that NHTSA data collection system is inconsistent and the agency “lacks an evaluation plan with criteria to assess whether to expand” the data it collects.
The Biden administration proposed to spend “$20 billion to improve road safety for all users, including increases to existing safety programs and a new Safe Streets for All program to fund state and local ‘vision zero’ plans.” It would be better to spend this, or whatever amount of money is allocated to road safety, by giving NHTSA a mandate to improve its accident reporting and analysis system with the aim of identifying ways to design more safety into existing road and street designs.
Some people use safety issues to justify their goal of eliminating, or at least greatly reducing, the use of automobiles. But those who truly believe in transportation safety regardless of mode should support a data-driven process of identifying and implementing safer roadway designs, motor vehicles, and transit systems.


#/media/File:Platform_of_Taisheng_Road_South_Station1.JPG)
I put a “Student Driver” sticker on my car…..Trust, me they leave you alone.
Traffic Related Fatalities by nation
US 2018: 39,888 (Per capita 12.4 per 100,000)
UK 2018: 2026 (per capita 2.9)
Germany: 3,327 (3.7)
Italy: 3333 (5.2)
US has the fourth highest of any nation
China: 261,000
India: 207,551
Brazil: 46,935
USA: 39,888
Step 1: Get Bad drivers off the round…
I saw a sample of “Germany DMV driving exam” english translated then saw how German’s how tough and strenuous it is to even get a license. Answer is simple, make the standards decent
Step 2: Penalize bad drivers: US, we have the “Point” system so if you’re involved in accidents or other circumstance
Since 1970 The United States has gone from leading the pack in traffic safety to being at the rear of that pack.
As a Whole EU had 22,000 traffic related fatalities. Almost HALF. There’s a reason for this….
A) they live more compactly, Hence speed limits are oriented on he local level to accommodate urban nicety. Cities aren’t “Loud and Polluted” Cars are loud and pollute.
B) Their road design favors more vulnerable users such as bikers and pedestrians
C) they have enacted laws and regulations that also favor these vulnerable road users.
US on the other hand, “Fuck Pedestrians”
Two other statistics that “aren’t the transit systems’ fault” are the death and injury resulting from forcing customers to walk the first and last mile and having to navigate through often busy traffic to transfer. Even though transit sets the scenario up, it accepts none of the liability for placing customers in harm’s way.
LazyReader,
Fatalities per 100,000 people is a bad measure because Americans drive so much more than people in other countries. It would be like comparing Oregon with Nebraska in ocean drownings per 100,000 residents.