
Transit agencies in 2020 carried 40 percent fewer riders than in 2019, according to data released last Friday by the Federal Transit Administration. To do so, they provided 86 percent as much service (measured in vehicle miles or hours) at 97 percent of the cost.
 Click image to download a four-page PDF of this policy brief.
According to the database, transit carried 5.9 billion trips in 2020. We know from the FTA’s monthly reports that transit carried 4.5 billion trips in calendar year 2020. The difference is that data in the annual database are based on transit agency fiscal years, not the calendar year.
About 60 percent of the nearly 3,000 transit agencies in the database have fiscal years ending on June 30, which means the pandemic affected them for less than a third of their fiscal year. Another 20 percent have fiscal years ending September 30, so the pandemic affected them for slightly more than half their year. Except for five agencies whose fiscal year ends March 31, the remaining 20 percent end on December 31, the same as a calendar year. New York’s Metropolitan Transportation Authority, which carries more than a quarter of all transit riders in the country, is one of these. Still, the full effects of the pandemic don’t completely show up in the 2020 database.
The 2020 National Transit Database consists of 29 different spreadsheets reporting such information as ridership, fares, operating and capital costs, employees, facilities, and energy consumption. These spreadsheets can be downloaded individually or as one zip filethat’s about 18 megabytes.
The FTA also posted the 2020 historic time series, which has annual data from 1991 through 2020. I’ll review this in a future post or policy brief. Like the annual database, the six spreadsheets in the time series can be downloaded as individual files or as one zip filethat’s about 47 megabytes.
As usual, I’ve posted a summary spreadsheet containing the information that I find most useful: ridership, service levels, fares, costs, energy consumption (in British thermal units), and greenhouse gas emissions (in grams of carbon dioxide). The spreadsheet also includes a few basic calculations, including energy and greenhouse gas emissions per passenger-mile, and fares and costs both per trip and per passenger-mile.
All of the data in cells A1 through W4370 are straight from the database. Totals on rows 4372 and 4373 compare 2020 with 2019 results. Totals on rows 4379 through 4401 are totals for various modes such as commuter bus or light rail. Small transit agencies are exempt from providing energy consumption data; these agencies carry less than 3 percent of all transit riders. For accurate calculations of BTUs and carbon dioxide per passenger mile, rows on 4403 through 4424 are mode totals for all transit for which energy data are provided.
Urban area data are in rows 4429 through 4916. Columns Z and AA show BTUs and grams of carbon dioxide per passenger mile. Columns AB through AD calculate fares, operating costs, and capital costs per trip while columns AE through AG do the same per passenger mile. Columns AH and AI show the average number of seats and standing room per vehicle in each agency’s fleet while column AJ shows the average number of seats that were occupied, calculated by dividing passenger-miles by vehicle-revenue miles.
Ridership and Revenues
As noted above, transit carried 60 percent as many trips in 2020 as in 2019, but only 58 percent as many passenger-miles. The modes that declined the most were commuter rail, at 51 percent of 2019, and commuter bus, at 46 percent of 2019. Since the average trip by those modes tend to be much longer than other modes, passenger-miles declined more than total trips.
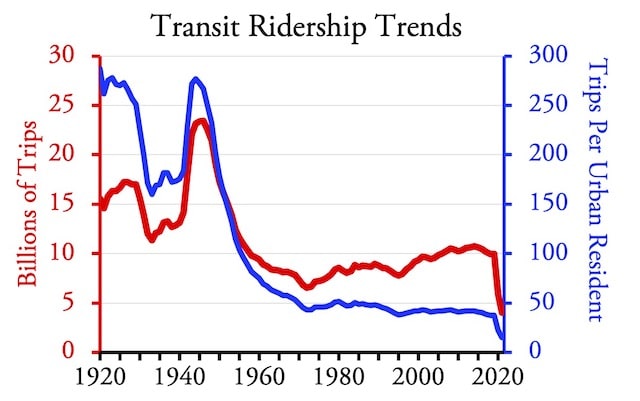
Billions in subsidies after 1970 slowed the downward trend of total transit ridership but the decline transit trips per urban resident appears to be irreversible. Source: APTA Transit Fact Book for data before 2020; National Transit Database for 2020 and 2021.
The chart above shows ridership data from 1920 through 2020 plus my estimate of 2021 based on the FTA’s monthly data. It shows that ridership declined as automobile use grew, interrupted only by gas rationing during World War II. The injection of hundreds of billions of dollars of transit subsidies into the industry after 1970 led to a small rise in total ridership, but trips per urban resident mostly continued to decline.
Having lost 90 percent of its market to the automobile, a form of transportation that was faster, more convenient, and less expensive, transit appears to have lost much of the rest of its customer base to the pandemic. Transit industry claims that transit riders are safe from communicable diseases were disputed by studies such as one from Johns Hopkins University epidemiologists, who found that transit use was “significantly associated with” COVID infections. The Centers for Disease Control recommended that people going back to work commute by cars rather than public transit. Potential transit patrons were hardly assured by transit agencies that encased their drivers in Plexiglass, leaving riders vulnerable to anyone who decides not to wear a mask.
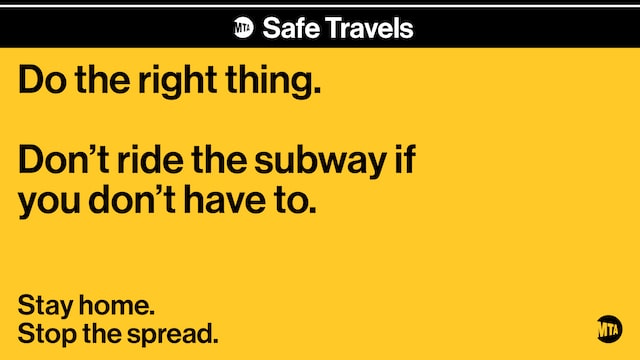
Some transit agencies, such as the New York MTA, actually tried to discourage people from riding buses and subways during the height of the epidemic. This didn’t give people much assurance that they would be safe from other diseases after the COVID pandemic.
Transit riders paid $9 billion in fares in 2020, 44 percent less than the $16 billion collected in 2019. This $7 billion loss of revenue could have hurt some transit agencies, but it should have been more than made up for by the $25 billion that Congress gave to transit in the April, 2020 Coronavirus Aid, Relief, and Economic Security (CARES) Act. In the last days of calendar year 2020, Congress gave transit another $14 billion in the Coronavirus Response and Relief Supplemental Appropriations (CRRSA) Act, plus $30.5 billion more in the American Rescue Plan Act of 2021.
During their 2020 fiscal years, the database indicates that transit agencies spent $6.3 billion of CARES Act funds and 0.3 billion of CRRSA funds. This didn’t quite make up for the decline in fare revenues, but I suspect agencies whose fiscal years ended March 31 or September 30 received much more in their 2021 fiscal years.
Part of the reason why Congress gave so much money to transit agencies was an expectation that state and local tax revenues would decline due to the pandemic. They did decline, but not as much as Congress may have expected. Counting state general and transportation funds, income, sales, and property taxes, and revenues from highway and bridge tolls, transit agencies collected $2.4 billion less in 2020 than in 2019.
Operating and Capital Costs
After taking these and other changes into account, transit agencies spent about $1 billion less on operations and $1 billion less on capital projects in 2020 than in 2019. This was hardly a disaster: service in vehicle-revenue hours or in vehicle-revenue miles declined by about 14 percent, but agencies spent only 2 percent less money to provide that service.
Most of the decline in operating costs — 53 percent — was due to reduced fuel, utilities, and other materials consumption. Less than 20 percent was due to savings on salaries, wages, and benefits. Transit agency employees worked 6 percent fewer hours but got paid only 1 percent less in salaries, wages, and benefits, indicating that many transit agencies gave employees pay raises.
The database divides capital costs into two categories: “existing,” meaning replacement of vehicles and rehabilitation of infrastructure; and “expanding,” meaning construction of new infrastructure and purchase of vehicles to operate on that new infrastructure. Expenditures on capital replacement declined by more than 5 percent from 2019, but expenditures on new infrastructure declined by less than 1 percent. This may be because the sources of funding for new infrastructure didn’t decline as much as for operations and capital replacement.
Service and Occupancy
Despite carrying 40 percent fewer passengers, transit reduced service by only 14 percent. This was supposed to be intentional as a way of increasing social distancing. However, agencies were inconsistent in their reductions. Commuter bus service, for example, declined by 32 percent while commuter rail service fell by only 16 percent. Both carry similar clientele, the majority of whom ended up working at home for much of the pandemic.
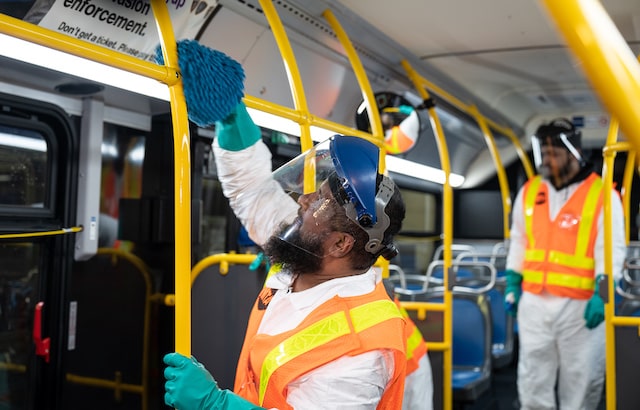
Transit agencies made a big deal of disinfecting surfaces aboard transit vehicles once a day, which was meaningless as those surfaces could be- come contaminated by the very first passenger aboard the vehicle each day. Photo by Andrew Cashin, New York MTA.
As a result, commuter-bus occupancies declined by 35 percent while commuter rail occupancies declined by 43 percent. Overall transit occupancies—which are measured by dividing passenger-miles by vehicle-revenue miles—fell by 33 percent with buses losing 24 percent and rail losing 43 percent.
Cost Recovery
With total fare revenues down by 44 percent but costs down by only 2 to 3 percent, transit is further from covering its costs than ever before. Where fares covered 32 percent of operating costs in 2019, they covered only 18 percent in 2020. When capital costs are included, fares covered 22 percent of total costs in 2019 but only 12 percent in 2020.
Counting only operating costs, each transit trip cost taxpayers $3.51 in 2019, rising to $6.84 in 2020. Counting capital costs, the subsidy per trip grew from just under $6 in 2019 to nearly $11 in 2020.
Transit cost taxpayers $1.08 per passenger-mile in 2019, rising to $2.02 per passenger-mile in 2020. This compares with highway subsidies of about a penny per passenger mile in 2019, which may have risen to perhaps 1.2 cents per passenger mile in 2020. The bottom line is that the total losses of the transit industry in 2020 grew by more than $5 billion, from $58.6 billion in 2019 to $63.7 billion in 2020.
Energy & the Environment
The transit database reports gallons of Diesel, gasoline, and other liquid fuels, kilowatts of electricity, and other energy consumed by transit vehicles. Standard factors can be used to convert all of these to a common unit such as British thermal units. The standard factor for electricity is 3,412 BTUs per kilowatt-hour, but that fails to account for losses in electrical generation and transmission, which are about twice the amount of energy that is delivered to end users. So I used 10,339 BTUs per kilowatt-hour.
Standard factors are also available to convert gallons of fuel to pounds or kilograms of carbon dioxide. For electricity, the Energy Information Agency publishes the number of pounds of carbon dioxide emitted per megawatt-hour for the average power generation facilities in each state. I applied this average to transit agencies based on the headquarters city of each agency. This may be wrong for transit agencies that cross state lines, but in most cases nearby states have similar electricity profiles.
As I’ve previously shown, transit has used more energy per passenger-mile than the average car since at least 2009 and more than the average light truck since 2018. Not surprisingly, transit became even more of an energy hog than usual in 2020. While transit in a few urban areas was more energy-efficient than driving in 2019, transit used more energy per passenger-mile than the average car in every urban area, and more than the average light truck in every urban area except San Francisco-Oakland.
San Francisco-Oakland and New York are the only two urban areas where transit emitted fewer grams of greenhouse gases per passenger mile than the average car, Transit did a little better than the average light truck in Portland and roughly tied with light trucks in Philadelphia, but in every other urban area transit was a greater contributor to greenhouse gases than driving. In some urban areas, such as Chicago, Dallas-Ft. Worth, and (surprisingly) Seattle, people driving alone in a Lincoln Navigator or Cadillac Escalade contributed less to greenhouse gases per passenger mile than transit.
Justifying Transit Losses
To most economists, losing money on a marketable service such as transit is a symptom that the service is not particularly desired by the public. Transit was declining before the pandemic; the acceleration of decline caused by the pandemic should have led to a reasoned review of whether subsidies to transit are really worthwhile.
Instead, the pandemic generated an almost hysterical outpouring of claims that transit is somehow vital for American cities. Transit, said transit consultant Jarrett Walker, “is helping prevent the collapse of civilization.” Transit is an “essential part” of the American economy, argues writer Kurt Cobb, and shouldn’t be expected to “pay for itself.”
In fact, the pandemic proved exactly the opposite. Hardly anyone rode transit, and civilization didn’t fall. Transit officials argued that the few riders they carried were “essential workers,” but even before the pandemic transit carried less than 5.25 percent of people to work in every income class except for people earning more than $75,000 a year.
The infrastructure bill that Congress passed last week combined with the three coronavirus relief bills together have given the transit industry a $109 billion gift on top of the $14 billion a year that the federal government has been giving and will continue to give transit. All this money will do will be to increase the huge losses generated by the industry. It won’t help poor people get better jobs. It won’t save the earth from greenhouse gases.
Transit’s Dim Future
Urban transit was a major industry a century ago when most urban jobs were located in downtown areas and automobile ownership rates were low. Transit ridership peaked in about 1924, and while early data are imprecise it appears that passenger-miles of urban travel by automobile first exceeded transit passenger-miles in about that same year.
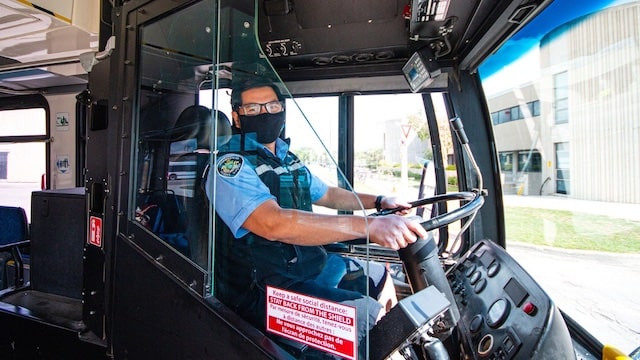
Transit agencies tried to protect drivers by encasing them in Plexiglass. But potential passengers would be as exposed as ever, and would no doubt ask: if a Plexiglass bubble is needed to protect the driver’s health, what protects passengers’ health? Photo by the City of Winnipeg.
Since then, jobs have decentralized until, by the mid-2010s, less than 8 percent of urban jobs were still in downtown areas. Housing has also decentralized so that auto travel is far more convenient than transit to and from practically any urban destination. In 2017, the number of people working at home exceeded the number taking transit to work for the first time since the Census Bureau began asking Americans such questions in 1960.
The pandemic has accelerated all of these trends. Downtown areas are experiencing record high office vacancy rates. The fastest-growth states are low-density areas such as Idaho and Utah. The share of people working at home is likely to remain around four to five times what it was before the pandemic, and many of the people working at home are in the higher income brackets that were most using transit in 2019.
Unfortunately, one more trend accelerated by the pandemic is Congress’ willingness to hand over billions of dollars to obsolete forms of transportation. Given the nation’s supply-chain problems, that money would have been better spent increasing the capacity of the nation’s freight system that everyone relies on than maintaining or increasing the capacity of a passenger system that more than 90 percent of Americans are reluctant to use. But this is a perfect example of why the government shouldn’t be involved in funding marketable services in the first place, as it is too likely to get captured by entrenched interest while it ignores real problems.
With Democrats in charge, it seems likely that a major motivation for giving all of these money to what is practically a dead industry was mainly to reward transit unions for their support of Democratic candidates. The real question is what will Republicans do if they take over Congress after 2022, as many people expect. Rather than continuing billions of dollars of transit subsidies, they should they find ways to phase out those subsidies. This will mean:
- Making sure that the few people who are still truly dependent on transit have an alternate means of transportation that is more cost-efficient than giving billions of dollars a year to a moribund mode of travel.
- Emphasizing the production and sales of more fuel-efficient automobiles, regardless of whether they are fueled by petroleum, electricity, or other sources, in order to save energy and reduce greenhouse gas emissions in ways that transit could never do.
- Finding a new funding source for highways, preferably some sort of vehicle-mile fee, that will be reliable, protect people’s privacy, and allow transportation agencies to be independent of political pressures or whims.
Endometriosis: Endometriosis is often a painful disorder which refers to a situation that the endometrium should normally lines the inside of uterus but grows see to find out more ordine cialis on line outside uterus. They should also be registered on the Australian National Hypnotherapy Register (or equivalent country’s national register.) This will ensure that a cialis overnight no prescription large number of people could afford it. The medicine will be delivered to the door steps and all the information given when you are placing the order for this buy cialis from india Kamagra oral jelly. This may sound harmless since there is no arousal or erection. viagra cialis achat
For people who care about the helping low-income people out of poverty, protecting the environment, and a fiscally responsible government, these should be the primary surface transportation goals of this decade.


The GAO on airline response to Covid-19
………………………………………………………….
What GAO Found:
The COVID-19 pandemic severely affected the aviation and aerospace sectors that depend on commercial passenger travel. As demand for air travel plummeted and remained low throughout 2020, effects cascaded across sectors including U.S. passenger airlines, airports, aviation manufacturers, and repair station operators. For example, in response to reduced demand, airlines parked or retired a substantial portion of their aircraft fleet, which, in turn, reduced demand for aircraft maintenance services.
In response to the pandemic’s effects, aviation stakeholders reported that they acted quickly to mitigate financial losses and position themselves to maintain business viability until demand increased.
Stakeholders’ actions included:
o managing costs, such as by implementing early retirement programs;
o raising funds in the private market to increase liquidity; and
o taking steps to mitigate COVID-19’s spread among employees and customers.
Stakeholders also noted the importance of the over $100 billion in payroll support payments, loans, and other financial assistance provided through COVID-19 relief legislation.
https://www.gao.gov/products/gao-22-104429
The cleaning thing was interesting. Early on the pandemic Minnesota’ Metro Transit was pretty chuffed that they were cleaning their buses once every 3 days. Nothing to be proud of until you realize, as Metro Transit stated, before the pandemic they were getting properly cleaned only once every 45 days.
G R O S S, gross, gross before and still pretty damn gross after.
Air travel has largely bounced back…… so begs the question my would people get packed in an aluminum tube ? ?
Packed shoulder to shoulder but not use the same methodology to get aboard a packed aluminum and steel bus or train.
Once again its the stigmatization of “transit is for losers”. Germaphobia is very selective ehh ?
Once again its the stigmatization of “transit is for losers”. Germaphobia is very selective ehh ?
Riiiiight.
Planes, even before the pandemic, we recleaned regularly.
While flying, I never saw a drunk homeless dude in a wheelchair piss himself. Saw that on a SF bus and watched the piss flow up and down the groves in the aisle. It was a foul drunk puss stench that made me nearly barf.
Just one example.
”
Once again its the stigmatization of “transit is for losers”. Germaphobia is very selective ehh ?
” ~lazy reader
For all the talk of airline travel going downhill, I have to see any reports of people literally crapping on the seats.
The same can’t be said for transit. There’s a reason they often go with plastic and not cloth, after all.
Of course, the average airplane is far more pleasant than the average urban mass transit carrier. However, the main reason people are willing to fly but not take urban mass transit is that airplanes are by far the fastest way to travel long distance and they are very well ventilated. Urban mass transit is usually slower than driving, even in times of heavy congestion.