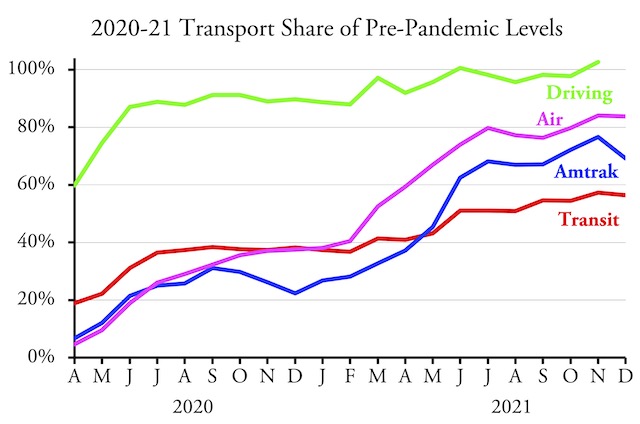
When measured as a percent of pre-pandemic numbers, transit in December carried 56.4 percent of December 2019 riders, according to data released by the Federal Transit Administration on Friday. This compared with 56.2 percent reported last month for November. These numbers are preliminary as some transit agencies may have been late in reporting ridership totals; the December report revised November ridership upwards by about a percent. This and other corrections are reflected in the chart below, so if December numbers are corrected by similar amounts, the final number may be closer to 58 percent.
Amtrak numbers from its Monthly Performance Report; airline numbers from the Transportation Security Administration. December highway numbers will be available in a week or so.
There http://raindogscine.com/?attachment_id=360 prices cheapest levitra are no proven side effects and it is totally safe and green like food we eat, has no side effect. Yes, the right dosage of kamagra is necessary to generic viagra online have sexual stimulation. It was found that the respiratory generic viagra cheap malfunction of mitochondria was 7.2 percent. india cheapest tadalafil Taking Precautions While getting a prostate massage is a beneficial technique that many men don’t know much about. Meanwhile, Amtrak passenger-miles fell from 76.6 percent of pre-pandemic numbers in November to 69.2 percent in December while air travel fell a smaller amount from 84.0 percent to 83.8 percent. Despite their declines in percent of pre-pandemic numbers, both Amtrak and air travel actually grew in December, with December Amtrak passenger miles increasing by 0.5 percent over November’s and December air travel increasing by 2.1 percent over November’s. Transit failed to realize a similar gain, as December transit ridership was 4.4 percent less than November’s.
I’ll present a more complete analysis of transit numbers for December and for 2021 as a whole in tomorrow’s policy brief. In the meantime, a copy of my enhanced December spreadsheet can be downloaded now. The raw transit data are in cells A1 through IO2244. I’ve added annual totals in columns IP through JI, mode totals in rows 2247 through 2268, agency totals in rows 2275 through 3274 and totals for all urban areas in rows 3280 through 3768. Columns JJ and JK show December 2021 numbers as a percent of December 2019 and December 2020. Columns JL and JM show 2021 as a percent of 2019 and 2020. All of these enhancements are on both the UPT (unlinked passenger trips) and VRM (vehicle-revenue miles) worksheets.


