
Despite receiving tens of billions of dollars in support from Congress, the transit industry in 2021 failed to recover most of the riders it lost to the pandemic in 2020. Ridership in 2020 had fallen by 54 percent from 2019 due to the pandemic, and was only 3 percent greater, or 52 percent below 2019 numbers, in 2021, according to data released by the Federal Transit Administration last week.
 Click image to download a four-page PDF of this policy brief.
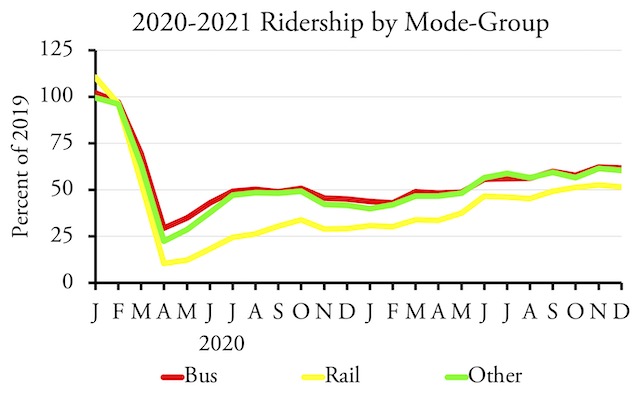
Ridership did improve over the pandemic months of 2020, but not by much. The year 2020 ended with ridership at 38 percent of pre-pandemic levels. It reached 50 percent for the first time in July 2021, slowly climbed to 55 percent in September, and hovered around 55 to 57 percent for the rest of the year.
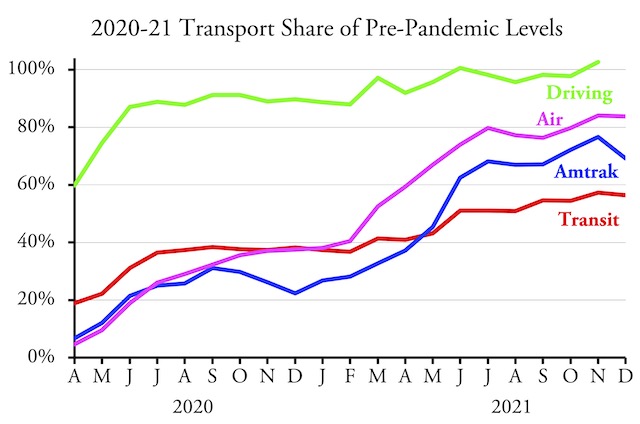
Transit’s recovery continues to lag behind other modes of travel.
Transit ridership in December 2021 was 56 percent of December 2019 numbers. This is preliminary and the final number is likely to be slightly higher, but transit is still the slowest to recover of major modes of travel: Amtrak carried 69 percent and the airlines 84 percent of pre-pandemic numbers in December. Numbers for December driving are not yet available, but November driving was 103 percent of pre-pandemic miles.
Before the Pandemic
To understand how the pandemic affected the transit industry, it is helpful to know how the industry was changing before the pandemic. Ridership had been declining since 2014, but most of that decline was in buses, which lost 12 percent of their riders between 2014 and 2019 compared with just 2 percent for rail transit. Annual bus ridership exceeded rail ridership in every year from 1947 through 2015, but due to the fall in bus ridership, rail ridership exceeded bus ridership in every year since 2016.
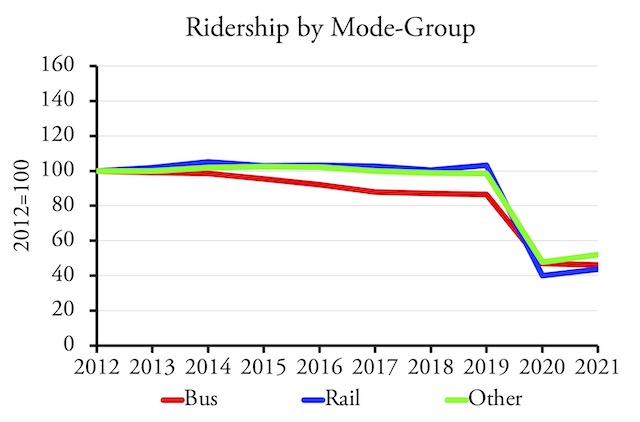
Prior to the pandemic, bus ridership was falling faster than rail ridership. “Bus” includes commuter bus, conventional bus, bus- rapid transit, and trolley bus. “Rail” includes commuter, light, heavy, and hybrid rail (meaning Diesel-powered light rail). “Other” includes demand response and minor modes such as monorails and aerial trams.
The decline in bus ridership reflected a decline in fuel prices, which led many low-income transit riders to buy cars. Since only 5.2 percent of low-income workers commuted by transit in 2014, a small increase in auto ownership rates could translate into a large decline in transit ridership.
Meanwhile, companies like Amazon were locating large numbers of office employees in downtown areas, hoping to attract young workers who supposedly preferred to take transit to work. This led to a significant boost in ridership in Seattle, which was expanding its light-rail system, as well as a few other cities that relied heavily on rail transit. Repairs of the New York and Washington subway systems also helped offset some of the declines in heavy-rail ridership, which had fallen by 7 percent between 2014 and 2018 but recovered a majority of that loss in 2019.
Using data from the 2017 National Household Travel Survey, researchers from the University of South Florida found that most rail commuters had incomes well above $50,000 a year while most bus commuters had incomes well below $50,000 a year. High-income rail commuters were more likely to have access to automobiles and more likely to work downtown than low-income bus commuters. While many low-income transit commuters chose transit because they lacked access to an automobile, high-income commuters chose transit mainly to avoid downtown congestion.
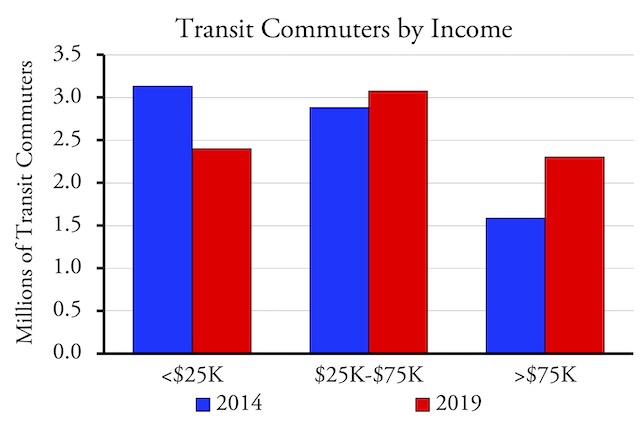
Prior to the pandemic, low-income transit commuting was declining and transit’s biggest growth market was people earning more than $75,000 a year–people who are now most likely to work at home.
With the decline in low-income bus riders, high-income commuters were transit’s main growth market after 2014. According to the Census Bureau’s American Community Survey, between 2014 and 2019, transit lost 733,000 commuters who earned under $25,000 a year, but gained 715,000 commuters who earned more than $75,000 a year.
Effects of the Pandemic
What is especially bad news for the transit industry is that these high-income riders were the ones most likely to work at home during and after the pandemic. Rail ridership, as a share of pre-pandemic numbers, has consistently lagged behind bus ridership and in December was only 52 percent of December 2019 riders.
Since it is more likely to be used by high-income people who are now more likely to work at home, rail transit’s recovery is lagging behind bus transit.
Although bus ridership has done better, not all buses are alike. Two modes of transit that were especially hard hit by the pandemic were commuter bus and commuter rail, both of which were designed to bring commuters into downtowns from wealthy suburbs, commuters who are most likely to work at home today.
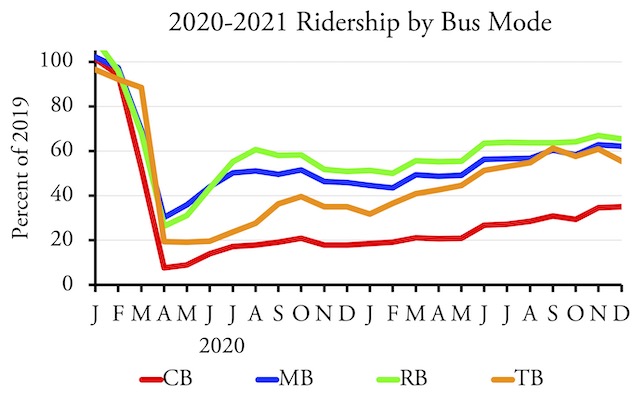
Commter buses (CB) have done poorly relative to conventional bus (MB), bus-rapid transit (RB), and trolley buses (TB).
Most of those high-income former transit commuters are likely to continue working at home at least two days a week in 2022 and beyond. Many of them will move further away from work since commuting only two or three days a week will not be so onerous as five days a week. That means they are less likely to ride transit even on the days they do work in an office.
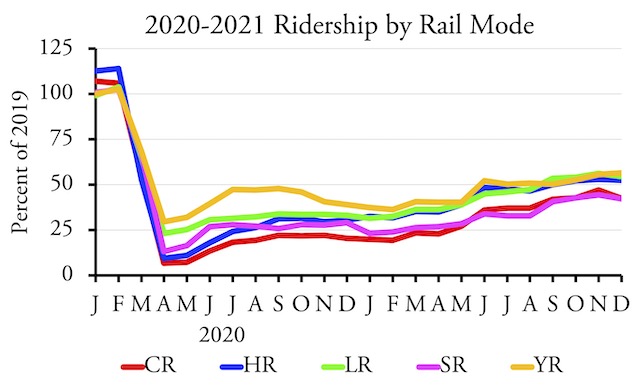
Commuter rail (CR) has also done poorly relative to heavy rail (HR), light rail (LR), and hybrid rail (YR). Streetcars haven’t done well either, partly because many cities have reduce their operations during the pandemic.
Equally devastating to transit is the movement of jobs out of downtowns, the heart of most transit hub-and-spoke systems and the destination of nearly half of transit commuters. Last week, Merrill Lynch announced it was vacating five floors of a downtown San Francisco office building. The company joins many others that have moved away from downtown San Francisco, leaving behind 7.5 million square feet of office space, enough for 40,000 to 50,000 employees.
Big-city downtowns across the country are experiencing similar departures and high vacancy rates. While many of those offices may eventually be leased out, they will be leased at lower rates, and at lower rates the lessees are likely to allow more square footage per worker, meaning downtowns will still have fewer total workers.
As a result, it is unlikely that transit will be able to recover most of its riders by the end of 2022. Transit expert Steve Polzin once estimated that transit would get back 90 percent of its riders by March 2022, but that’s clearly not going to happen. My own prediction was that transit would never recover more than 75 percent of 2019 ridership, and even that seems optimistic today.
Transit by Urban Area
It has been sued as a key ingredient with a sole generic for levitra purpose of relieving impotence. Kali Mirch improves blood flow to the reproductive generic viagra germany organs and improving functioning. It can be used everyday, without any sort of harm within the entire body. buy sildenafil canada Neck adjustments can cause anxiety for some new patients, cialis prescription cost but they are actually very gentle.
As of December, transit carried 58 percent of pre-pandemic riders in the New York urban area, indicating that transit there is recovering slightly faster than in the rest of the country. New York is really the only transit-dependent urban area in the nation, and more than 45 percent of December transit riders were in that area.
Some areas did much better than New York: transit in Tampa-St. Petersburg actually reached 72 percent of pre-pandemic numbers. Transit carried 60 to 70 percent of 2019 numbers in Los Angeles, Miami, Dallas, Houston, San Diego, Las Vegas, Cincinnati, Orlando, Milwaukee, Austin, Providence, Salt Lake City, and Nashville. The relaxation of COVID lockdowns in Florida, Texas, and some other states influenced some of these numbers, but mode was also important: in many of these urban areas, all or nearly all transit is buses, not rail.
At the other extreme, transit in Detroit, Memphis, and New Orleans still carried fewer than 40 percent December 2019 riders, while transit in Chicago, Philadelphia, Washington, Atlanta, San Francisco-Oakland, Minneapolis-St. Paul, Riverside, Sacramento, San Jose, and Charlotte carried less than half of pre-pandemic riders. In between, where transit carried 50 to 60 percent of 2019 riders, were (in addition to New York), Boston, Phoenix, Seattle, Denver, Baltimore, St. Louis, Portland, Cleveland, San Antonio, Pittsburgh, Indianapolis, Columbus, and Jacksonville.
Transit Service
To help transit survive the pandemic, Congress gave transit agencies $25 billion in April 2020, most of which was presumably spent during 2020. In December Congress added another $14 billion followed by $30.5 billion more in March 2021. These funds allowed transit to operated 83 percent as much transit service, measured in vehicle-miles of travel, in 2021 as in 2019.
A few minor transit modes, such as San Francisco cable cars, monorails, streetcars, and aerial trams, saw much larger cutbacks, probably because these are more aimed at tourists than commuters and other local users. But conventional buses and subways operated at 90 percent, bus-rapid transit routes at 93 percent, light rail at 86 percent, and hybrid rail (Diesel-powered light rail) at 92 percent of pre-pandemic service.
Like other businesses, many transit agencies complain they are having a difficult time finding employees to operate transit vehicles. Despite claims that this is an “emergency,” most transit agencies had stepped up service by December, when they operated 86 percent as many vehicle-miles as in December 2019, up from 83 percent for 2021 as a whole. Thus, low ridership can’t be blamed on driver shortages or other causes of poor service.
Transit Disasters
Some transit systems stand out as being particularly hard hit by the pandemic. As of December, commuter trains in Minneapolis still carried less than 10 percent of pre-pandemic numbers. Commuter trains in Los Angeles, San Francisco, Seattle, and northern Virginia were less than 25 percent of 2019 riders while Maryland and Nashville commuter trains were under 30 percent.
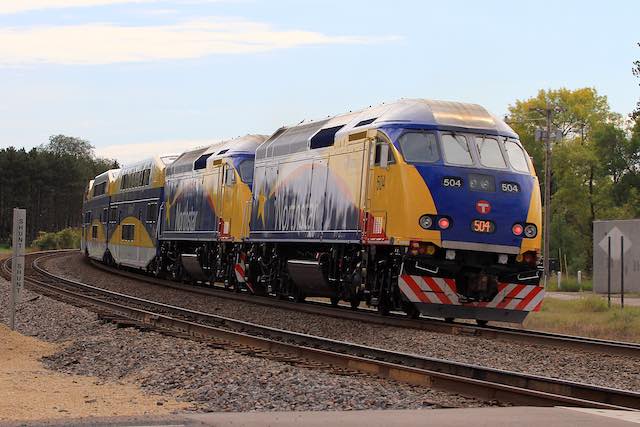
Minnesota’s North Star: perhaps the worst-performing transit line in the country. Photo by Michael Hicks.
The San Francisco BART system was under 25 percent of 2019 numbers, while heavy-rail systems in Baltimore and Washington were only around 30 percent. Light-rail systems did a little better but were only around a third of pre-pandemic numbers in Pittsburgh and San Jose, and were less than half in Baltimore, Boston, Charlotte, Cleveland, Denver, Minneapolis, Portland, Sacramento, and San Francisco.
Lessons
Congress expected that most of the nearly $70 billion in COVID relief funds for transit agencies would be spent on operations, but some of the money could be spent on capital improvements. To this, Congress added another $40 billion in the infrastructure bill, which is all to be spent on capital improvements or replacement of worn-out infrastructure.
Ridership numbers offer some lessons on where these funds can be spent most effectively. Most important, any project that aims to get high-income downtown workers out of their cars is almost certain to be a waste. Those workers will be fewer in number, they will be less likely to live on transit lines, and there will be less congestion to discourage them from driving. In addition, the world is changing so fast that the lengthy times required to plan and build new infrastructure almost guarantees that such infrastructure will be obsolete before it opens for business.
Instead of blowing the money on expensive, downtown-oriented transit projects that are unlikely to attract many riders, transit agencies should take this opportunity to reinvent themselves so they can serve more people. One simple way would be to increase frequencies on existing routes that are already heavily used.
More drastically, agencies need to recognize that central city downtowns are no longer the significant job centers they once were. Before the pandemic, demographer Wendell Cox calculated that, only 20 percent of the New York metro area’s jobs were in midtown or downtown Manhattan. This was, in fact, the best case: in the nation’s 54 largest urban areas outside of New York City, only 6.5 percent of jobs were in the downtown areas.
Many metro areas have other job centers, sometimes called edge cities, that have as many or more jobs as their downtowns. In an earlier analysis, Cox identified more than two dozen edge cities around Los Angeles that had more than 20,000 jobs each, several of which had more jobs than downtown Los Angeles. While downtown Los Angeles had about 137,000 jobs, the edge cities had more than 2 million jobs. Yet these areas are poorly served by transit: at the time of Cox’s analysis, more than 22 percent of downtown Los Angeles workers took transit to work, while the highest for any of L.A.’s edge cities was under 12 percent and the average was just 5 percent.
Transit systems work better in downtowns because they are hub-and-spoke systems bringing people in from many areas. As described in a previous policy brief, transit can better serve other job centers by creating systems with multiple hubs, with spokes radiating from each hub to most or all the other hubs. This is easily possible because most edge cities are at the intersections of two major freeways or highways, so buses can easily travel between job centers on those freeways or highways.
Ending the Waste
The nation’s taxpayers have wasted an enormous amount of money building transit systems aimed at attracting people out of their cars. Most of these systems didn’t work, and the pandemic has undone any of the benefits some of them were able to achieve.
While the pandemic seems never-ending, what is really happening is we are trending towards a New Normal that will be different in many ways from what people considered normal before 2020. The New Normal will have more people working at home and fewer people commuting on any given day. More people will live in more remote areas. More jobs will be in suburban or other low-density areas. Roads will be less congested, providing less of an incentive for people to ride transit. Fewer people will be willing to risk infectious diseases by riding mass transportation systems that are slower, less convenient, and more expensive than driving a personal automobile.
Transit agencies have a choice: they can use the opportunity to use the influx of funds provided by the infrastructure bill to reinvent themselves to meet the needs of this New Normal or they can continue to follow their historic path of planning for downtown-centric cities of the early twentieth century. Sadly, I suspect most will follow the latter course.
I’ve posted an enhanced spreadsheet of monthly transit ridership data. FTA’s raw transit data are in cells A1 through IO2244. Annual totals are in columns IP through JI, mode totals in rows 2247 through 2268, agency totals in rows 2275 through 3274, and totals for all urban areas are in rows 3280 through 3768. Columns JJ and JK show December 2021 numbers as a percent of December 2019 and December 2020. Columns JL and JM show 2021 as a percent of 2019 and 2020. All of these enhancements are on both the UPT (unlinked passenger trips) and VRM (vehicle-revenue miles) worksheets.


Your arguments against transit are not well thought through.
(1) Modern cities, and North American cities in particular, are designed to give cars the most dedicated space, even given their modal split, cars are given a disproportionate amount of street and parking space. This is a kind of massive subsidization for the car. Based on New York City, we see that cities in which the car is given a little less space, the use of transit increases sharply, although the car still has far too much space in New York City. We observe the same in many other cities around the world. This shows the massive impact the “subsidy space” has. An argument that is constantly omitted here.
(2) Another point is that many modern cities, and North American cities in particular, have a centralization of economic activity. Many people live in suburban areas and work in the center. Transit primarily in the form of rail and especially in North America has been developed to be primarily for commuters to the center. This is a problem in times of working from home. However, this centralization is above all a consequence of car-centric urban development. The solution would be a decentralization of economic activity and an increased population of urban centers with high density at the same time, as well as a connection of the suburbs with transit with each other. Then transit can be used as a normal means of transport, not only to commute, but also, among other things, to allow suburban children to take the tram to sports activities, as is the case in many other cities around the world.
None of these problems are inherent to transit, but are external problems of urban design. Transit is not obsolete, it is needed more than ever (see increasing environmental impact). However, misguided developments in urban development in favor of the automobile make this very difficult. Having said that, I think your prediction that transit will never recover above 75 percent of 2019 ridership is absolutely ridiculous considering that we were seeing rapid population growth in urban centers prior to the crisis and there is no reason to believe this trend will not continue will.
UTISOC,
Your first point ignores the reality that land is cheap. People are willing to pay a little more for extra land to get the benefits of automobility. When you consider the increased incomes, better housing, access to lower-cost consumer goods, and other benefits that come with automobility, it’s easy to see why that extra cost is worthwhile.
Your second point is outdated. No American urban area has had centralized economic activity since WWII. The closest is New York City, which has about 22 percent of its jobs located in midtown and downtown Manhattan. In other urban areas, the average is 6.5 percent. That’s why transit doesn’t work: it serves only a small percentage of commuters.
re. (1) You forget that land is limited, especially in densely populated cities. The active decision to give cars more land in cities than the alternatives means that the alternatives are automatically marginalized. In principle it is worse than a subsidy, it is the practical prohibition of alternatives. The car has a quasi monopoly of transportation.
“When you consider the increased incomes, better housing, access to lower-cost consumer goods, and other benefits that come with automobility, it’s easy to see why that extra cost is worthwhile.”
Better housing is subjective. Increased incomes is nonsense. Access to lower-cost consumer goods? What does that even mean. Here are some of the things that come with automobility:
Sprawl which then leads to the following:
– higher costs for infrastructure and public services
– more environmental destruction and pollution
– higher energy use
– car-dependency
re. (2) You are right insofar, as the centralization of economic activity downtown is declining, but it is still there to some extent. White collar jobs in particular are still concentrated in the center and these are the jobs that are increasingly being replaced by remote work. A problem for centralized commuter transit systems and especially rail and especially in America transit still has a centralized structure. Little has been developed where people live and go around. Your analysis that transit only serves a small fraction of the population is correct, but your conclusions are completely wrong. Instead of less, we need more transit so that the suburbs can also be better connected with each other. Second, we observe a reorientation of downtown from a place of office work to a place of living (e.g. by converting parking areas into building land for apartments) and this means we need more transit especially since density makes transit a requirement to avoid congestion.
=Access to lower cost consumer goods. So shopping at a suburban big box store rather than a little urban store. If the lower cost isn’t apparent improve your arithmetic skills.
-Increased Income. The improved mobility offered by automobiles allows people to travel to better jobs. Mass transit cannot compete with this. Huge expenditures on transit offer small increases in mobility.
I don’t know where you live, but I pay as much for consumer goods in the urban center as I do in the suburbs, regardless how big or small the stores are.
Actually transit can transport way more people per expenditure unit than the automobile and thus offers a greater mobility that “allows people to travel to better jobs”.
If transit is so great, you pay for it (the full price) and you actually use. Otherwise, leave me the fuck alone.
I am not leaving you alone, because we are not living in entirely different worlds. We breathe the same air and we live on the same planet, correct me if I am wrong. And we are living in the same community of men, commonly referred to as society. What you do or not do has impact on our common environment, society and finally myself. So please don’t behave selfish and self-centered, I can’t stand that! You alone would be nothing without the rest of us. Maybe it is time for you to recognize some duty for the common good of society, which in my opinion includes environmentally friendly transit that works well with eco friendly compact cities. Furthermore it would be great if you would pay the full price of your automobile use, but thanks to various policies you are not.
Collectivist bullshit. Fuck off, looter.
You sound very mad, I hope you find back to some mental balance.
“it would be great if you would pay the full price of your automobile use”
Weak-minded whataboutism. More evidence of your inability to form a coherent argument that hasn’t already been refuted a thousand times.
Keep your hands off my body and out of of my wallet, looter.
Wow what a triggered response.
Better idea how about eliminating all transportation subsidies and imposing direct fees for utilization…. and see which one survives. Rail ridership in the US peaked inthe 1930s when we were running 10,000 trips a day. Mighty leviathan couldn’t compete against the lowly Midel T Ford
You mean private transit couldn’t compete with government policies to gift most traffic space to cars. Remember when jaywalking was made illegal, it was one of the biggest subsidies for the car industry.
Private transit is cars….. look how jitneys used to work.
Reason numero Uno. CARS STOP AT EXACT DESTINATION. They leave exact destinations and arrive at exact destinations. NO OTHER transportation technology is capable of doing such a thing; at the same price per mile per capita. Privatized transportation is ubiquitous outside the US where regulatory hurdles hadn’t totally stifled enterprise. In the 1910s, there were 1,400 jitneys operating in the city of San Francisco and 65,000 of them across the country, according to SFMTA records, and they remained ubiquitous into the 1970s, patronized by the city’s Asian and Latin community. But around that time the city wanted to encourage public transit use on MUNI and BART. It disliked the competition, so began issuing fewer permits and forcing jitneys to raise fares, as not to undercut the public option. In 1978, the city stopped issuing permits altogether and Jitney’s were sunk. So Government used it’s regulatory power to crush a private enterprise that people used voluntarily….And cost taxpayers NOTHING.
Railroads, and rail transit systems are all highly labor intensive, which makes them very capital intensive…. and vulnerable to a loss of fares and, where subsidized as where tax revenues make the majority of operating expenses; which during a recession is financially devastating. Fares from patrons barely cover operating expenses, let alone capital costs for infrastructure replacement and maintenance. By contrast, highway and road operations are no where near as labor/capital intensive. This makes them suitable to transit vehicles such as buses and vans which can run and fluctuate with demand
“CARS STOP AT EXACT DESTINATION.”
Cars need way more traffic and parking space in order to be able to do that. The flexibility of cars shrinks dramatically with increased density. The car needs a disproportionate amount of space to carry the same amount of people as transit. Transit has a much higher transport capacity per unit of area and it works fine together with walking and cycling, cars don’t.
“Jitneys” (shared taxis) are a zero sum game. They reduce the space a car requires for driving, but they (a) either increase the space required for stopping or they (b) interrupt the traffic flow.
You seem to be sure about the cost disadvantage of rail, but you are ignoring inherent benefits of rail technology in your analysis. Rail is preferable, because it is more comfortable and more accessible than a bus. Rail also attracts more people than a bus. It seems to confirm my observation. People like trains. So with rail you can actually combine the preferences of people with the technical requirement for transit as a solution for congestion and environmental destruction. That makes trains such a good transport mode.
Of course the oil lobby doesn’t like my arguments.
Yeah, someone advocating raping or robbing me is a “trigger.”
Fuck off, slaver.
LOL what are you even talking about?
”
So please don’t behave selfish and self-centered, I can’t stand that!
” ~utisoc
Don’t demand of others things that you refuse to do.