
America’s transit systems carried 65.0 percent as many transit riders in June 2022 as in June 2019, according to data released last week by the Federal Transit Administration. This is the first time ridership has exceeded 61 percent of pre-pandemic levels since the pandemic began.
Data are not yet available for Amtrak or driving.
Much of this surge in ridership was due to fuel prices, which reached record levels in mid-June. Now the question is whether transit will be able to keep those riders, as prices have fallen every day since June 16. As of yesterday, average prices are lower than they have been since early March.
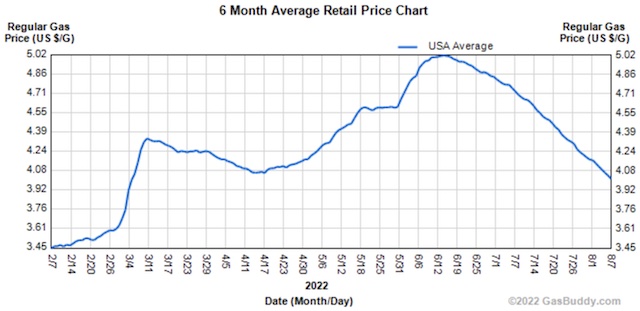
Average fuel prices from GasBuddy.com.
Amtrak usually publishes its monthly performance data before the Federal Transit Administration but its June report is late. According to the Transportation Security Administration, 89 percent as many passengers few commercial airlines in June 2022 as in June 2019. TSA counts both domestic and international travelers; domestic flyers only is probably around 95 percent of pre-pandemic levels. At least, it was 95 percent in April, when the TSA counts were at 90 percent.
Driving data won’t be available for a week or so. It had exceeded 100 percent of pre-pandemic levels for 10 of the previous 12 months, but will probably dip a bit in June due to fuel prices.
As usual, I’ve posted an enhanced spreadsheet of transit data that includes annual totals, and totals by mode, agency, and urban area. The spreadsheet shows that transit in the New York urban area has recovered a bit more than most, reaching 69 percent of pre-pandemic levels. As a result, more than 48 percent of all transit rides in the nation were carried in the New York region.
Other urban areas where transit is doing better than average are Los Angeles (71%), Miami (79%), Houston (70%), and San Diego and Tampa (both 78%). Kansas City, which stopped charging transit fares early in the pandemic, was at 78 percent, but Nashville and Salt Lake City were at 79 percent despite still charging fares, while Austin, Cincinnati, Indianapolis, and Orlando were not far behind Kansas City. Richmond was nearly 100 percent and Bridgeport-Stamford and Tucson were both above 105 percent.
Transit is doing worse than average in Phoenix and Minneapolis-St. Paul (both 52%), Chicago, Washington, and San Francisco-Oakland (all 54%), Baltimore, St. Louis, Riverside-San Bernardino (all 55%), and Portland and San Antonio (both 57%). Worst off among major urban areas is Charlotte at just 44 percent.


