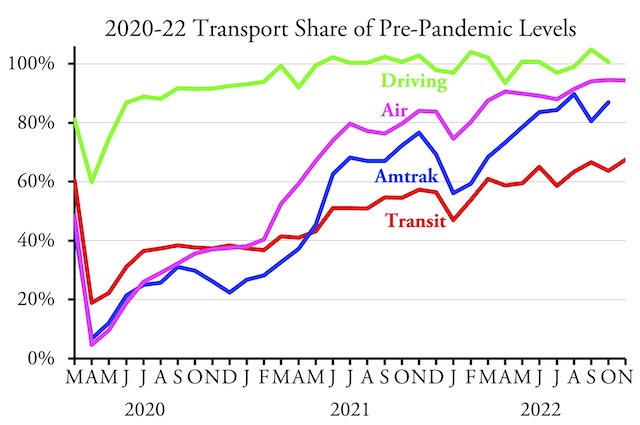
Transit ridership in November 2022 was 32.5 percent below November 2019, according to data released late last week by the Federal Transit Administration. This is in spite of the fact that November 2022 had one more work day than November 2019.
Amtrak and highway data are not yet available but this chart will be updated when they come out.
U.S. airlines saw 94.3 percent as many travelers in November as in the same month in 2019, down slightly from 94.5 percent in October. Amtrak data should be available soon; highway data seem to take a little longer.
Although transit carried only 50 percent of pre-pandemic levels in January, 2022, it reached 65 percent in June and has been hovering around 65 percent since them. As noted here last week, more people are doubting that it will ever rise much above 65 percent again.
One bright spot is Kansas City, where November ridership was slightly more than 90 percent of November 2019 numbers. That’s because Kansas City began charging zero fares in November 2020, effectively adding $9 million a year to the agency’s operating subsidy. The only other major urban areas where transit exceeded 75 percent of pre-pandemic ridership were San Diego, Tampa-St. Petersburg, Cincinnati, Jacksonville, Nashville, and Richmond.
Among the nation’s other major urban areas, November ridership was between 70 and 75 percent of pre-pandemic numbers in the New York, Los Angeles, Miami, Las Vegas, Austin, and Salt Lake City urban areas. Ridership was below 55 percent in Detroit, Phoenix, San Francisco-Oakland, and Riverside-San Bernardino. It was below 60 percent in Chicago, Philadelphia, Washington, Atlanta, Minneapolis-St. Paul, Denver, St. Louis, Portland, Virginia Beach, and Columbus.
Transit agencies are predicting that transit will go off a fiscal cliff when they run out of COVID relief funds. The reason is simple: even though they are carrying only about two-thirds as many riders, and thus earning only about two-thirds the fares (or 0 percent in the case of Kansas City), they have continued to operate 90 percent as many buses and trains as before the pandemic.
Moreover, they have allowed costs to bloat, so they are spending more money than before the pandemic. They are clearly expecting Congress and state and local taxpayers to bail them out. The alternative is simple : reduce service to meet actual demand, just like every other business. The transit agencies, however, this is unthinkable.
As usual, I have posted an enhanced spreadsheet. The raw FTA spreadsheet has monthly ridership (unlinked passenger trips or UPT) and service (in vehicle-revenue miles or VRM) from January 2002 through November 2022. My enhancements include annual totals, mode totals, transit agency totals, and urban area totals. I hope you find it useful.


