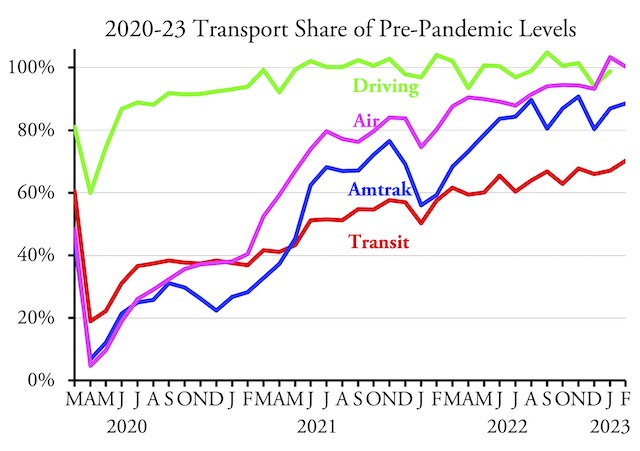
Public transit carried 70.2 percent as many riders in February 2023 as it did in the same month in 2019, according to data released by the Federal Transit Administration late last week. This is the first time ridership has exceeded 70 percent of 2019 numbers since February 2020.
The transit line on this chart has been updated to reflect the latest adjustments to the National Transit Database going back to late 2020.
Amtrak, meanwhile, reports that it carried close to 89 percent as many passenger-miles and the Transportation Security Administration reports that airlines carried more than 100 percent as many passengers in February 2023 as in February 2019. February highway data will be released later this month.
The major driver of transit’s recent increase is the New York urban area, where transit carries 46 percent of all transit ridership in the nation. New York transit reached 76.0 percent of 2019 numbers in February, which significantly brings up the nationwide average.
Outside of New York, transit is doing particularly well in the Miami urban area (which includes Fort Lauderdale and West Palm Beach), where it carried 96.1 percent of 2019 riders. Ridership actually exceeded 100 percent of 2019 numbers in Richmond (101.0%), Hartford (105.1%), Bridgeport-Stamford (123.4%), Oklahoma City (102.5%), and Tucson (111.4%). However, it is still doing poorly in Chicago (56.2%), Atlanta (53.3%), Phoenix (49.1%), San Francisco-Oakland (55.6%), and St. Louis (57.6%).
The spreadsheet shows that Cincinnati transit carried less than 20 percent of 2019 riders, but that’s because the region’s largest transit agency hasn’t reported any numbers since December 2022. That error will eventually get fixed in future updates.
Despite the growth in ridership in rail-heavy New York, buses are still doing better than rails overall, as buses carried 71.8 percent while rails carried 68.4 percent in February. Bus rapid transit lines are doing particularly well at 80.9 percent, while commuter buses are performing poorly at 47.5 percent. Heavy rail was 69.3 percent, commuter rail 66.1 percent, light rail 65.6 percent, and hybrid rail (Diesel-powered light rail) was just 56.2 percent.
A close look at Amtrak’s numbers reveal that its long-distance trains are doing best, carrying 95.5 percent as many riders as in 2019. Next are the Northeast Corridor trains at 90.6 percent. Worst are the state-supported trains, which carried only 76.8 percent as many riders as in 2019. Naturally, Amtrak plans to use the tens of billions of dollars that Congress gave it in 2021 mainly to increase state-supported trains.
Thanks to generous support from Congress, Amtrak and most transit agencies remain completely oblivious to the effects of the pandemic on their businesses. They assume that ridership will eventually fully recover without them having to change their business models, or if not that taxpayers will rescue them from the fiscal cliff they are about to drive off of.
It is worth noting that Richmond, one of the cities whose transit ridership has fully recovered, had completely redesigned its bus system just before the pandemic. Yet most other transit agencies have not expressed any interest in doing similar redesigns. Instead, they simply offered 95 percent as much service (and spending more than 100 percent as much money) in February 2023 as February 2019, running buses and trains over the same routes that, in most cases, were losing ridership before the pandemic.
This is a result of the fact that transit agencies rely far more on tax dollars than fares, making them more beholden to politicians than to their nominal customers. Transit agencies in Los Angeles, Seattle, Phoenix, and many other cities have replaced transportation with construction as their raison d’être, as they contribute to local labor shortages by spending billions of dollars building transit infrastructure that few people will use. At least a few people are beginning to recognize that simply throwing more money at transit serves no public interest.
As usual, I’ve posted an enhanced spreadsheet with the raw FTA data in cells A1 through JB2250; annual totals in columns JC through JY; mode totals in rows 2253 through 2273; transit agency totals in rows 2280 through 3278; urban area totals in rows 3281 through 3770; and ridership in February 2023 expressed as a percent of February 2019 in column JZ and a percent of February 2022 in column KA. I hope you find this useful.


