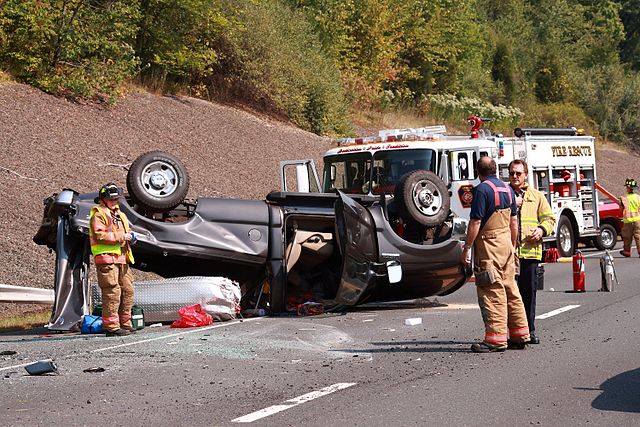
Highway fatalities declined slightly in 2022 despite an increase in the miles of driving, and they declined again in the first three months of 2023. However, the changes are small and it’s too soon to say whether this is a trend or just a short-term quirk in the data.
Photo by Ragesoss.
Short-term changes in fatalities and fatality rates are something of a mystery. In the long run, safer roads and safer cars have pushed down fatalities from a peak of 55,600 in 1972, for a rate of 44.1 deaths per billion vehicle-miles of travel, to a low of under 32,500 in 2011, for a rate of only 11.0 deaths per billion vehicle-miles. The rate fell even lower to 10.8 per billion in 2014.
A particularly large drop of more than 20 percent that took place between 2007, when more than 41,000 people were killed on the roads, and 2011 was accompanied by a slight drop in driving. Due to the 2008 financial crisis, Americans drove 2.3 percent fewer miles in 2011 than 2007. Did the reduction in driving have anything to do with the reduction in fatalities, or were people just more careful drivers in the wake of the recession?
The pandemic led to a much larger drop in driving. Americans drove 11 percent fewer miles in 2020 than 2019. Yet this drop was accompanied by a 7 percent increase in fatalities, and fatalities increased another 10 percent in 2021 even though driving still hadn’t recovered to 2019 miles. Nearly 43,000 people were killed on the roads in 2021, the first time the number exceeded 40,000 since 2007, pushing rates up to 13.5 per billion vehicle-miles.
While no one knows for certain why fatalities dropped between 2007 and 2011, many think the increase since 2011 has been due to the increased use of smart phones, which distract both drivers and pedestrians. The numbers don’t necessarily bear this out: in 2021, only 8 percent of fatal crashes were report to involve at least one distracted driver. But people involved in fatal accidents may be reluctant to admit they weren’t paying attention to the road, so the actual number may be much higher.
The most dangerous roads are non-freeway arterials. Detailed data are not yet available for 2022, but 2021 saw around 20 fatalities per billion vehicle-miles on such roads, almost twice the average of all roads. Rural roads are more dangerous than urban ones, with an average of more than 17 vs. less than 12 fatalities per billion miles.
Yet it is the urban roads that have seen the biggest increase in fatalities in recent years. Between 2007 and 2011, rural fatalities declined by 26 percent while urban fatalities grew by 43 percent. The biggest increase was in urban arterials (up 71 percent) and collectors (up 115 percent). Freeway fatalities grew by a much smaller amount and fatalities on local urban roads declined.
Between 2007 and 2011, pedestrian fatalities grew by 57 percent. According to the National Highway Traffic Safety Administration’s database, all of this increase was in urban areas, where pedestrian fatalities grew by 80 percent while rural pedestrian fatalities declined by 8 percent. Most of the increase in urban areas was on urban non-freeway arterials and collectors, which saw pedestrian fatalities more than double.
Moreover, most of this increase was at night and took place away from crosswalks, where pedestrian fatalities grew by 150 percent on urban non-freeway arterials and 244 percent on urban collectors. As I’ve noted before, for some reason urban pedestrians are putting themselves in harm’s way by failing to use crosswalks to cross major streets at night. While it easy to say “don’t blame the victim,” something about personal behavior has changed to produce this dramatic result. Anecdotal evidence indicates that a large share of this increase involves homeless people.
Early results from 2022 indicate that these trends may not be continuing. Fatalities declined on urban arterial and collector roads while they grew slightly on most rural roads. Pedestrian fatalities declined slightly though bicycle fatalities grew.
The reduction in urban fatalities might be due to the successful implementation of vision zero plans. But it could also be due to a relative decline in urban driving as the pandemic led many people to move to exurban areas, which would also explain the increase in rural fatalities.
Highway safety is far more complicated than vision zero’s simplistic “slow everything down” philosophy. Cities need to take a close look at the data to find the most effective policies for making roads safer for everyone.


31% all traffic fatalities involve drunk drivers. Wanna reduce deaths.
1st DUI/DWI suspension drivers license for a year. Next 3 breathalyzer installed in your car.
2nd, 4 years in jail. license suspended permanently.
Kill someone in accident, 15-25.
If 4 years in prison surrounded by men who wanna rape you is insufficient to teach people not to drink and drive they shouldn’t be on our streets ever again.
Texting while driving or cellphone use in general, 2000 dollar fine or 3 month license suspension. 2nd attempt year license suspension.
Injure, kill a pedestrian, not their fault, prison.
Law enforcement needs to treat distracted driving like the danger it is.
What’s the fine for DWBJ?
Isn’t pedestrian fatalities up because of increase usage of SUVs over cars?
Pedestrian fatalities are up because they too text and walk. There’s very little penalty for using a phone while walking on street.
More importantly localities are no longer prosecuting Jay walking and dangerous street practices. Public advocacy groups argue jaywalking tickets, etc. Unfairly target blacks, hispanics….Why is that surprising people of color dominate bulk nations misdemeanors when they already constitute bulk nations violent felonies……