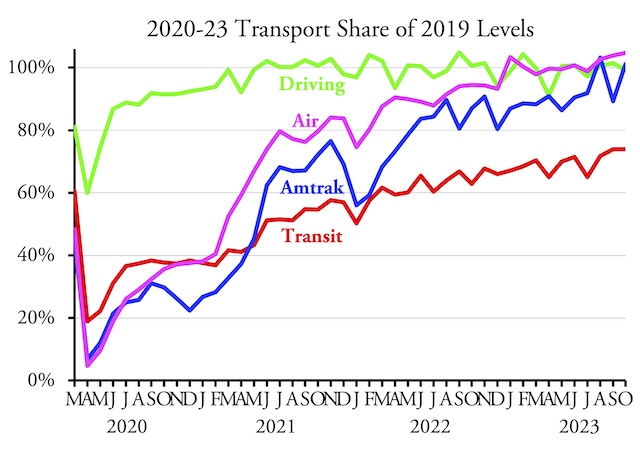
Americans drove more than 99 percent as many miles in October of 2023 as they did in the same month in 2019, according to data released yesterday by the Federal Highway Administration. Miles of driving have been hovering around 100 percent of pre-pandemic levels since March of 2021.
Transit and airline performances in October were reviewed on December 7 and Amtrak’s on December 11.
Although driving has recovered, the places and times people drive have changed. Rural driving is 2 percent ahead of 2019 numbers while urban driving is 2 percent behind. Within both rural and urban areas, driving is greater on interstate freeways than on other arterials and greater on other arterials than on other roads and streets.
Some states have seen large increases in driving while others still fall well short. This is partly due to people moving from the latter states to the former. California saw 15 percent less driving than before the pandemic, while Idaho saw 10 percent more and Arizona 20 percent more. Other states with large increases include Rhode Island (16%), South Dakota (15%), Alabama (14%), Louisiana (13%), Arkansas (12%), and Missouri (10%). Other states that remain well short of 2019 numbers include Hawaii (-23%) and West Virginia (-18%) plus the District of Columbia (-14%).
Another reason for these disparities is that some states are more urban than others. Since urban driving remains a little lower than 2019 while rural driving is more, states whose populations are more rural are more likely to see more driving than in 2019.
The recently released data don’t show driving by time of day, but I suspect there is less at rush hour and more during other times of the day, reflecting the number of people still working at home. As one article points out, “The pandemic didn’t kill rush hour in America — it just spread traffic throughout the day.” As I’ve pointed out before, people who work at home don’t drive less than when they commuted to work, they just drive at different times of the day.


